The prior post covered the growth of milk production in the U.S. This post covers the domestic disappearance and consumption of dairy products. Is the growth in consumption cooling off? Is inflation causing changes in consumption? Is the increase in milk production needed?
This post is based on new data that was not available during the government shutdown. The data is based on 12-month moving averages to minimize cyclical fluctuations. The data in the charts below are based on the annual growth of domestic consumption using domestic disappearance data. The charts below cover the trends over five years, from 2021 to 2025 YTD.
Chart I shows the growth of domestic butter consumption. Domestic butter consumption had been decreasing as there were concerns about saturated fats causing unhealthy heart conditions. Current research has shown that the saturated fat in butter does not result in unhealthy heart conditions and is a positive health item in diets. In 2023 the growth rate of domestic butter consumption increased significantly. In 2024 and 2025 the growth rate has leveled off to just around 6% annually. This is slightly less than the growth rate in mid 2024 but is still a very significant growth rate.
Chart II below shows the growth rate of cheese consumption. The growth rate has slowed since 2022 and has become negative in 2025. Cheese is the largest user of U.S. milk and has a huge influence on the overall growth of the dairy industry.
In 2024 and 2025, the growth rate of domestic Dry Whey consumption lost volume, down from a growth rate of 39% annually to a -29% annual growth rate in 2025 (Chart III).
Chart IV covers the domestic consumption growth rates of Nonfat Dry Milk (NDM) and Skim Milk Powder (SMP). The growth rate of dry skim consumption dropped in 2024 as the purchase of fluid milk (See Chart V) had growth. In 2025 the growth of fluid milk lost all growth, and dry skim milk made a comeback. Could this be influenced by inflation and food prices?
After many years of declining consumption, the growth rate of fluid milk showed growth in 2024. Unfortunately, in 2025, the growth rate returned to a decline (Chart V).
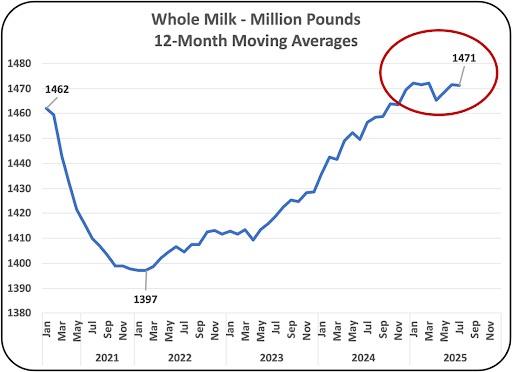
Chart VI shows a major change in Whole Milk sales as sales leveled out in 2025. Without the growth in sales of whole milk, the decline in total fluid milk covered in Chart V has become negative.
CONCLUSION
The increase in dairy sales which spurred the increase in milk production may be short lived. Only domestic butter consumption is showing healthy growth and that growth rate has leveled out.
The prior post covered the growth of milk production in the U.S. This post covers the domestic disappearance and consumption of dairy products. Is the growth in consumption cooling off? Is inflation causing changes in consumption? Is the increase in milk production needed?
This post is based on new data that was not available during the government shutdown. The data is based on 12-month moving averages to minimize cyclical fluctuations. The data in the charts below are based on the annual growth of domestic consumption using domestic disappearance data. The charts below cover the trends over five years, from 2021 to 2025 YTD.
Chart I shows the growth of domestic butter consumption. Domestic butter consumption had been decreasing as there were concerns about saturated fats causing unhealthy heart conditions. Current research has shown that the saturated fat in butter does not result in unhealthy heart conditions and is a positive health item in diets. In 2023 the growth rate of domestic butter consumption increased significantly. In 2024 and 2025 the growth rate has leveled off to just around 6% annually. This is slightly less than the growth rate in mid 2024 but is still a very significant growth rate.
Chart II below shows the growth rate of cheese consumption. The growth rate has slowed since 2022 and has become negative in 2025. Cheese is the largest user of U.S. milk and has a huge influence on the overall growth of the dairy industry.
In 2024 and 2025, the growth rate of domestic Dry Whey consumption lost volume, down from a growth rate of 39% annually to a -29% annual growth rate in 2025 (Chart III).
Chart IV covers the domestic consumption growth rates of Nonfat Dry Milk (NDM) and Skim Milk Powder (SMP). The growth rate of dry skim consumption dropped in 2024 as the purchase of fluid milk (See Chart V) had growth. In 2025 the growth of fluid milk lost all growth, and dry skim milk made a comeback. Could this be influenced by inflation and food prices?
After many years of declining consumption, the growth rate of fluid milk showed growth in 2024. Unfortunately, in 2025, the growth rate returned to a decline (Chart V).
Chart VI shows a major change in Whole Milk sales as sales leveled out in 2025. Without the growth in sales of whole milk, the decline in total fluid milk covered in Chart V has become negative.
CONCLUSION
The increase in dairy sales which spurred the increase in milk production may be short lived. Only domestic butter consumption is showing healthy growth and that growth rate has leveled out.
After reading the headline, many readers are probably wondering “Why is this …
The prior posts reviewed the amazing gains in producer productivity. Increases in …
The last post covered gains in butterfat and protein content. Protein levels …
The prior four posts were mostly bad news for producers. Commodity prices, …