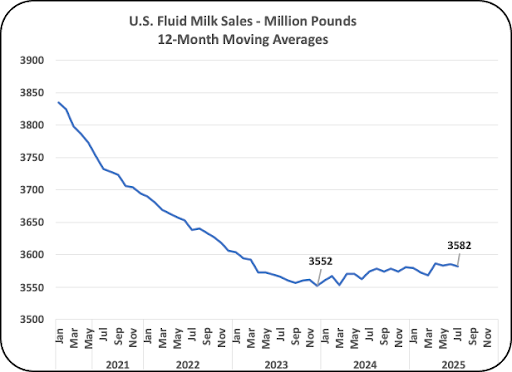
Fluid milk for drinking was the leading dairy product in the 1900’s. Since then, sales have dropped every year until 2024. Because fluid milk is a saturated fat it was considered a possible contributor to clogging arteries. With changes in the medical field, dairy products have now been classified as being a healthy product providing nutrients, especially for growing children. With that change in perception, drinking milk sales have started to grow. Although the sales increase in drinking milk is only one-half of one percent annually, it is no longer decreasing which is a big step forward (Chart I below).
This post will cover details of this growth.
The growth in milk sales is an important health improvement. Also important, it is a boost for the dairy industry. Fluid milk (Class I milk) is the highest priced milk benefiting producer and processor financials through increases in both prices and volume. A big factor in the pricing is the significant increase in the Class I differential (See this recent post)
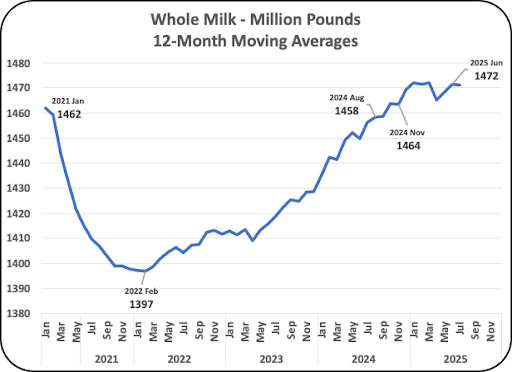
One of the important changes is that “Whole” milk is providing the growth (Chart II). Whole milk sales have increased by 5% over the last four years. Whole milk contains 3.5% butterfat by law. That is considered a benefit in health and taste. The taste benefit is very important because a better tasting product will encourage consumption. The increase due to a better taste is very important especially for growing children who have many other beverage choices.
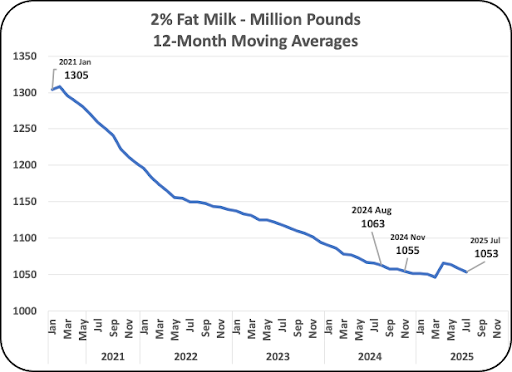
Some of the growth in whole milk is coming from the decrease in 2% milk. Over the last five years, 2% fat milk has fallen by 20% (Chart III below). This can only be the result of the better taste of whole milk.
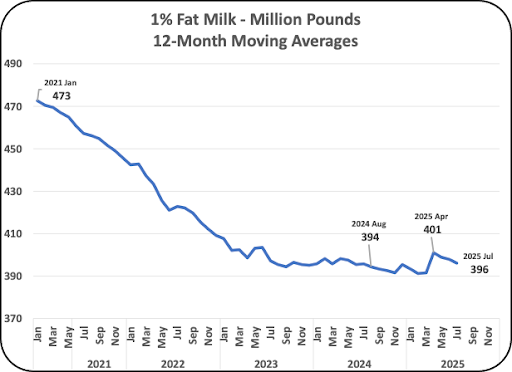
Chart IV shows the decline in 1% fat milk. The rate of the 1% fat milk decline has slowed as it is reaching a minimal level. The decrease in the last five years is 16%.
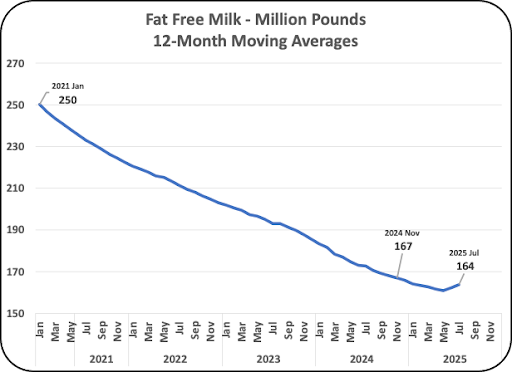
As mentioned in other posts to this site, fat free milk sales have dropped by 35% over the last five years. The decrease has recently slowed. Fat free milk has decreased to the point that some retail locations have or maybe are considering dropping fat free milk to make room for products that move faster.
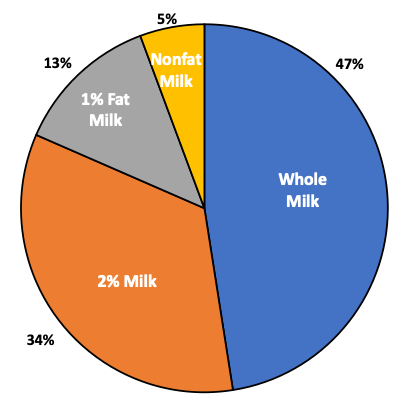
Chart VI below shows the current mix of milk sales. Whole milk is nearing 50% of milk sales. The 2% fat milk is still a major player with 34% of the milk sales. The 1% fat milk and nonfat milk now make up only 18% of the milk sales.
The last four posts listed below covered de-pooling in detail. One of the important factors in reducing de-pooling is to increase the value of Class I drinking milk. Below are links to these posts.
Whole milk has more butterfat than fat reduced milks. Butterfat is worth more than the slim milk. With a greater percent of Whole milk, there will be more butterfat in the blend of the Class I milk. By having more butterfat in Class I milk, the value of Class I milk will increase. Whole milk contains 3.5% butterfat and the current mix of all Class I milk in total averages 2.5%. This does decrease the opportunity of negative Producer Price Differentials and de-pooling.
Fluid milk for drinking was the leading dairy product in the 1900’s. …
At the conclusion of the prior post, de-pooling of California Class IV …
The Northeast Federal Order has done a good job of minimizing de-pooling …
Why is milk de-pooled? Well, it’s all about money. The concept of …
We determine the economic impact of balancing amino acids in dairy rations. This enables you to view personalized results including: Income Data, Milk Per Cow/ Per Day, Economic Growth and overall value calculations updated automatically based on current FMMO prices.
We determine the economic impact of balancing amino acids in dairy rations. This enables you to view personalized results including: Income Data, Milk Per Cow/ Per Day, Economic Growth and overall value calculations updated automatically based on current FMMO prices.
