


Long -Term View of Component Prices

Long -Term View of Component Prices

Many prior posts from this Blog Spot and other sources have expressed the problem for dairy farmers with the low price of components and the high price of feed, employees, and other expenses.  This post will cover a long review of dairy component values.  Long-Term in this post means the trends cover 27 years.

Chart I shows the component prices from the start of 2000 when the current Federal Milk Orders were developed.  Prior to 2020, the Federal Milk Orders were very different.   There were 31 Federal orders in 1999.  There are now 11 Federal Orders.  Not much has changed in the last 27 years, except for changes in how the components are valued.  The changes typically reduce what dairy farmers get from their milk.    Inflation during these 27 years increased by 93%. 

Chart I is complicated.  It is based on 12-month moving averages.  If monthly values were used there would be 954 points on the Chart for the three components followed in this Chart.
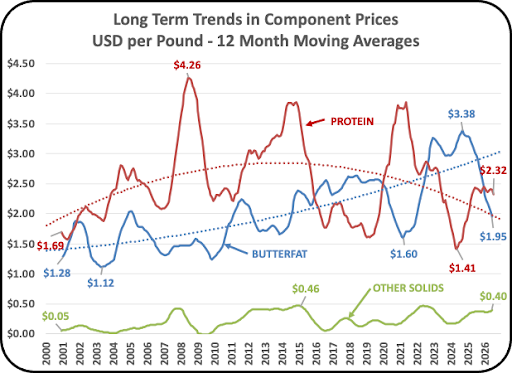
Chart I – 12-month Moving Averages of Component Prices

PROTEIN

Protein prices are in red in Chart I.  At the start of 2000, the price of protein was $1.69 per pound.  In July 2026, the price of protein was $2.32 per pound.  This is a 37% increase in price over 27 years.  That is significantly less than the 93% increase in U.S. inflation.  In May of 2025 the price of protein was $1.41, which is 13% lower that in the start of 2000!

The red trend lines show a peak in value in 2014 and a decrease since then.  The monthly peak in 2007 was $4.26, in 2014 the monthly peak was $3.85, and in 2021 the peak was $3.86. during COVID.  The low in 2009 was $2.20, the low in 2019 was $1.61, and in 2024 the low was $1.41.  The highs get lower and the lows get lower.  This is not just a current drop in protein prices, the drop in price follows a trend of 20 years, from 2007 to 2026.

BUTTERFAT

The blue trend line for butterfat prices looks very encouraging.   Unfortunately, the decline in 2025 and 2026 looks very discouraging.  Over the 27 years in this chart the value of butterfat has increased from $1.28 per pound to $1.95, an increase of 52%.    That is still a long way from the 93% inflation.  

Over the course of Chart I, the butterfat trend line shows increases, but the value in 2025 and 2026 is showing a trend toward lower prices.  In 2024 Butterfat hit a high of $3.38 and in July of 2026 the price is $1.95.  The trend line will soon be changing direction.

OTHER SOLIDS

Other Solids makes a small contribution to Class III producer revenue.  However, over the span of the Chart, the price of Other Solids has increased from $.05 to $.20 per pound, an 800% increase.  There was a time in 2009 when the value of Other Solids was a negative value.   It has reached a high of $0.50 per pound and is now $0.40 per pound.

SUMMARY

Over the span of the chart, protein has carried the highest price most of the time.  In 2026, it has again delivered the highest price of the three components.  However, the current protein prices show no increase in 2026.  Overall, a milk producer is getting lower revenue at a time when cost of operations continues to increase.  Combined with the high volatility covered in prior posts, milk production is a difficult business to sustain.

Other recent posts are available at this link, and older posts are available at this link.

Subscribe via email

This field is for validation purposes and should be left unchanged.

Get new posts by email:

Cheese

Dry Whey

Cash prices - Butter / Cheese

FMMO Price Announcements

Resources

Blog Archive

Many prior posts from this Blog Spot and other sources have expressed the problem for dairy farmers with the low price of components and the high price of feed, employees, and other expenses.  This post will cover a long review of dairy component values.  Long-Term in this post means the trends cover 27 years.

Chart I shows the component prices from the start of 2000 when the current Federal Milk Orders were developed.  Prior to 2020, the Federal Milk Orders were very different.   There were 31 Federal orders in 1999.  There are now 11 Federal Orders.  Not much has changed in the last 27 years, except for changes in how the components are valued.  The changes typically reduce what dairy farmers get from their milk.    Inflation during these 27 years increased by 93%. 

Chart I is complicated.  It is based on 12-month moving averages.  If monthly values were used there would be 954 points on the Chart for the three components followed in this Chart.

Chart I – 12-month Moving Averages of Component Prices

PROTEIN

Protein prices are in red in Chart I.  At the start of 2000, the price of protein was $1.69 per pound.  In July 2026, the price of protein was $2.32 per pound.  This is a 37% increase in price over 27 years.  That is significantly less than the 93% increase in U.S. inflation.  In May of 2025 the price of protein was $1.41, which is 13% lower that in the start of 2000!

The red trend lines show a peak in value in 2014 and a decrease since then.  The monthly peak in 2007 was $4.26, in 2014 the monthly peak was $3.85, and in 2021 the peak was $3.86. during COVID.  The low in 2009 was $2.20, the low in 2019 was $1.61, and in 2024 the low was $1.41.  The highs get lower and the lows get lower.  This is not just a current drop in protein prices, the drop in price follows a trend of 20 years, from 2007 to 2026.

BUTTERFAT

The blue trend line for butterfat prices looks very encouraging.   Unfortunately, the decline in 2025 and 2026 looks very discouraging.  Over the 27 years in this chart the value of butterfat has increased from $1.28 per pound to $1.95, an increase of 52%.    That is still a long way from the 93% inflation.  

Over the course of Chart I, the butterfat trend line shows increases, but the value in 2025 and 2026 is showing a trend toward lower prices.  In 2024 Butterfat hit a high of $3.38 and in July of 2026 the price is $1.95.  The trend line will soon be changing direction.

OTHER SOLIDS

Other Solids makes a small contribution to Class III producer revenue.  However, over the span of the Chart, the price of Other Solids has increased from $.05 to $.20 per pound, an 800% increase.  There was a time in 2009 when the value of Other Solids was a negative value.   It has reached a high of $0.50 per pound and is now $0.40 per pound.

SUMMARY

Over the span of the chart, protein has carried the highest price most of the time.  In 2026, it has again delivered the highest price of the three components.  However, the current protein prices show no increase in 2026.  Overall, a milk producer is getting lower revenue at a time when cost of operations continues to increase.  Combined with the high volatility covered in prior posts, milk production is a difficult business to sustain.

Other recent posts are available at this link, and older posts are available at this link.

Subscribe via email

This field is for validation purposes and should be left unchanged.

Get new posts by email:

Cheese

Dry Whey

Cash prices - Butter / Cheese

FMMO Price Announcements

Resources

Blog Archive

New MilkPrice Resources

Check out our resources to learn more from MilkPrice!

Many prior posts from this Blog Spot and other sources have expressed …

Many prior posts from this Blog Spot and other sources have expressed …

Many prior posts covered the issue of “Too Many Cows and Too …

Prices for producer milk are low.  The primary factors are low butterfat …

Latest Blog