

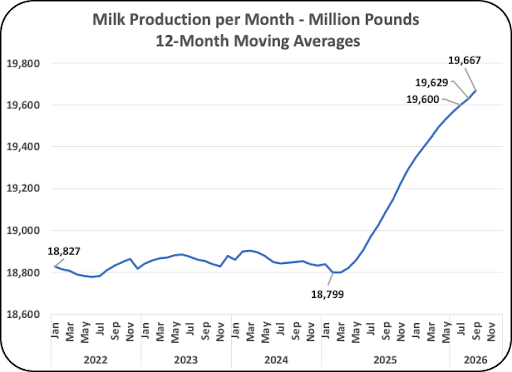
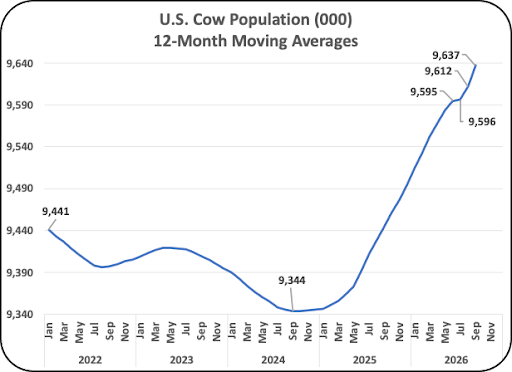
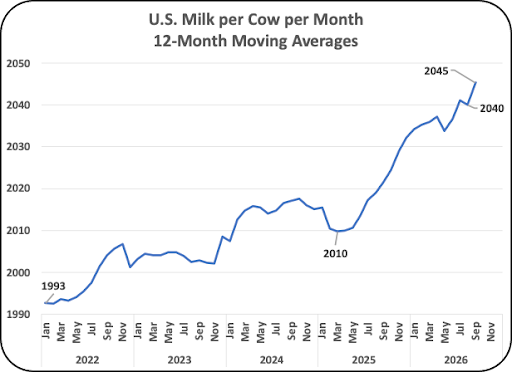
Starting in 2025, the dairy industry developed a strong and steady growth. This post will update the growth of the major elements with the latest published data. Everything is up! Data is presented in these charts based on 12-month moving averages to eliminate seasonal patterns. The growth shows no slowdown.
Chart I tracks the growth in milk production. Milk production is currently growing at 2% annually. This Chart shows a two-year trend of increasing milk production.
The number of cows is also growing at 2% annually (Chart II). The current level of milk cows is record-setting and shows no signs of slowing down.
The increase in milk per cow has been increasing but the increase is choppy (Chart III). The current rate of increase has been 1% annually. The increase in milk per cow combined with increases in the percent of butterfat and protein covered in Charts IV and V, improve producer revenue.
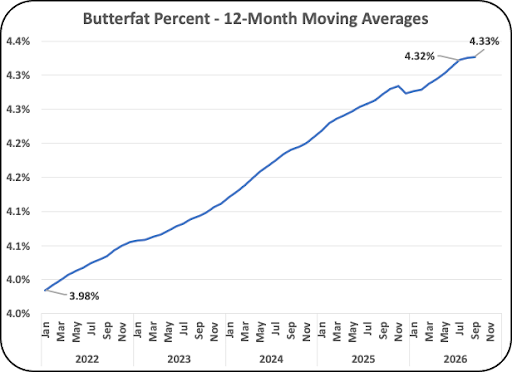
The U.S, growth in butterfat percent in milk has continued to grow and is presently at 4.33% (Chart IV). The growth rate has recently slowed but is still growing. Over the course of the five years in these charts, butterfat levels have increased by 9%.
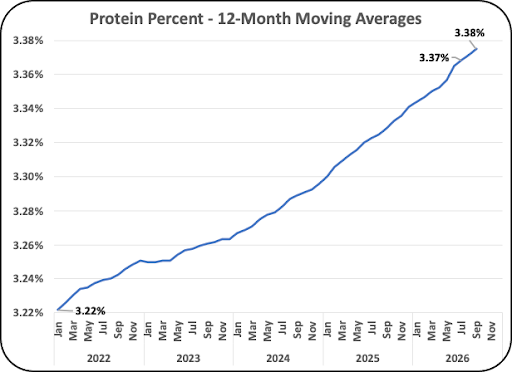
The growth in protein percent is accelerating and is presently at 3.38% annually. Over the course of the five years in this chart, protein levels have increased by 5%. While butterfat percent growth has slowed, the increase in protein percent is growing faster. This reflects the growth in cheese production which is covered below in Chart VI. Protein is needed to match with the butterfat levels.
The growth of butterfat and protein are influenced by the fact that butterfat is paid to all producers while protein is paid only to milk producers when the milk is used for cheese production.
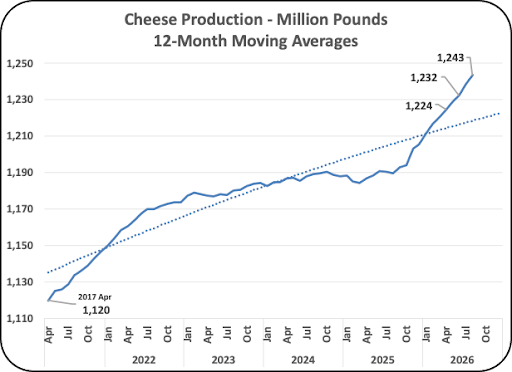
Cheese Production is growing at a rate of 4.5% annually (Chart VI). The rate of increase has been steady in 2026. A year ago, there was no growth in cheese production. Cheese production is now using two thirds of the U.S. milk produced.
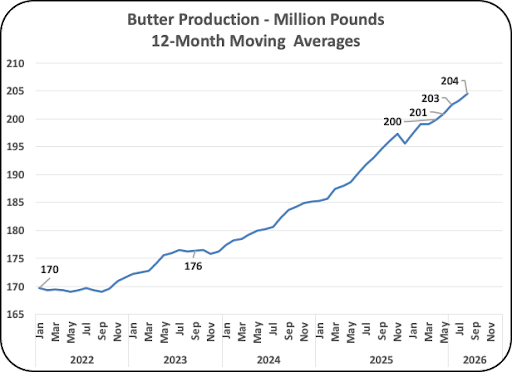
Butter production is continuing to grow at an annual rate of 6.4%. Export growth will be covered in detail in the next post. Canada is a prime recipient, and recent tariff increases make these exports more difficult.
SUMMARY
The growth in the dairy industry shows no sign of a slowdown. How long can this rate of increase continue? The next post will cover the U.S. consumption rate and exports for major dairy products.
With a healthy inventory of commodities, the wholesale price of the commodities used to price components remain low and therefore component prices are low.
Starting in 2025, the dairy industry developed a strong and steady growth. …
The prior post covered volatility in dairy component prices. The protein price …
The prior post covered volatility in dairy component prices. The protein price …
The prior post covered volatility in dairy component prices. The protein price …