 2024-09-16 at 7.28.53 AM")
 2024-09-16 at 7.30.29 AM")
 2024-09-16 at 7.32.05 AM")

This is Part II of the series defining ways to increase producer revenue. Part I covered increased components. This post will cover the state-by-state milk per cow and the annual percent increases in milk per cow. More milk per cow can deliver more components and add revenue with minimal cost.
To set the scene, Table I lists the five largest milk producing states. Together they produce 54% of U.S. milk. The five largest are California, Wisconsin, Idaho, Texas, and New York. California is the largest by far with Wisconsin as second. The remaining three are major milk producing states, but they produce less than half the volume compared to Wisconsin.
The highest ranked states in milk per cow are listed in Table II. Michigan is setting the pace for the most milk per cow, with Colorado, Texas, Wisconsin, and New York at less than 10% behind.
Table III lists the three lowest milk per cow among the major milk producing states. It is surprising to see that California, the largest milk producing state is in this list just slightly better than Minnesota and Pennsylvania.
How much is milk per cow increasing? In June of 2020 the annual percent increase in milk per cow in the U.S. was high, reaching an increase of 1.8% (Chart I). Since then, the increase in milk per cow has dropped and is currently averaging around .5%.
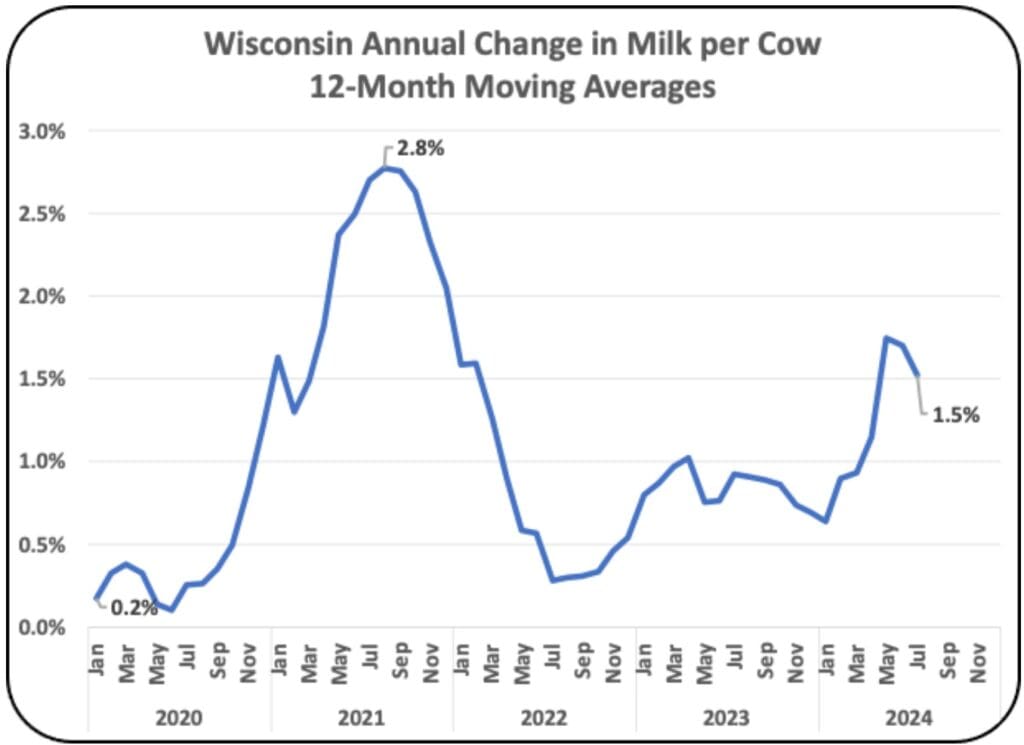
Wisconsin (Chart II) has accomplished a consistent monthly increase in milk per cow. Over five years, there have been no monthly decreases. Milk per cow has jumped from 2005 pounds per month per cow to 2127 pounds, a 6% increase. At the current Class III price of $20 per cwt., and a herd of 500 cows, that is worth $146,000 per year.
Using the tested and verified sciences to increase component levels is available to all. Why would any producer not utilize these tools to increase revenue?
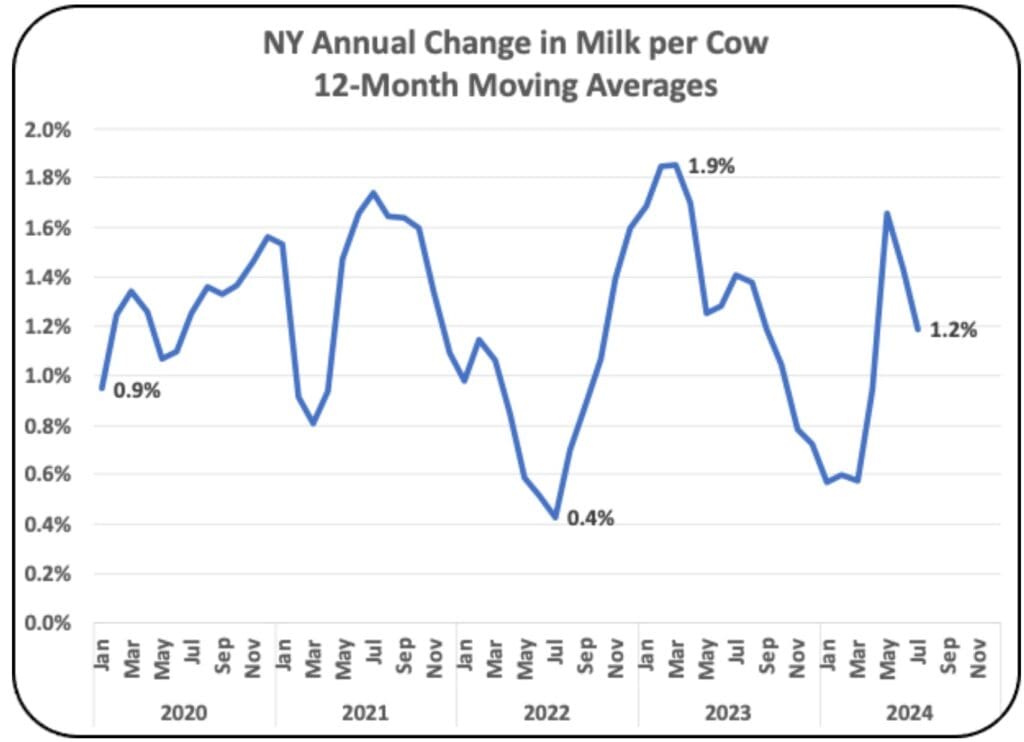
The state of New York has increased milk per cow by 7% over the five years in Chart III. As shown above in Table II, New York state is now averaging 2127 pounds of milk monthly and is in the top five states in milk per cow.
Using the same calculations as used above for Wisconsin, the New York revenue increase for a herd of 500 cows is worth $158,000 a year.
Using the tested and verified sciences to increase component levels is available to all. Why would any producer not utilize these tools to increase revenue?
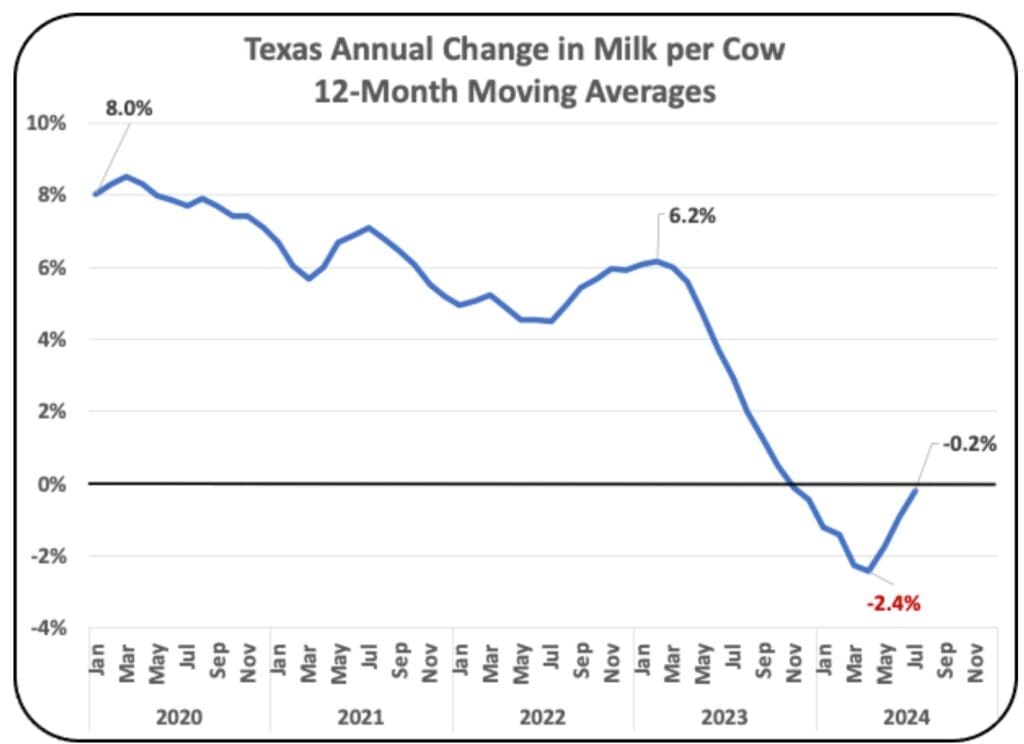
Texas was increasing milk per cow at a rate of 6% to 8% annually. But beginning in 2023 that rate of increase has dropped steadily to a decrease of -2.4%. They have now broken the downward trend with a current small increase.
By the same calculation made for Wisconsin, the increase in revenue is worth $179,000 annually.
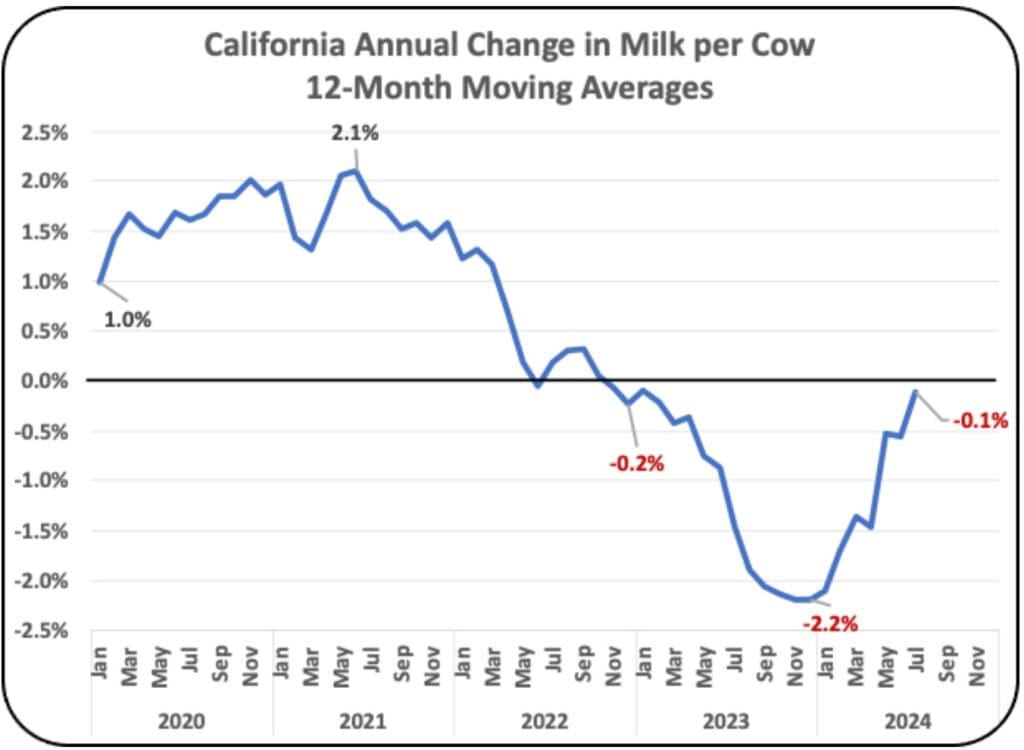
The biggest fall in milk per cow is California. Their milk per cow numbers have been dropping for over two years. They changed from a 2.1% annual increase in June 2020 to an annual negative growth rate of -2.2% in December 2023.
The amount of milk per cow is growing, but it is slower than in 2020 and 2021. Only two states, Wisconsin and New York show a continuous annual improvement in in milk per cow. Over the five-year span, both states increased milk per cow by over 6%. They have also increased total milk production continuously.
There are many ways to increase milk per cow. There are positive economics as more milk brings additional components and revenue. Being a producer in the U.S. requires constant improvement.
This is Part II of the series defining ways to increase producer revenue. Part I covered increased components. This post will cover the state-by-state milk per cow and the annual percent increases in milk per cow. More milk per cow can deliver more components and add revenue with minimal cost.
To set the scene, Table I lists the five largest milk producing states. Together they produce 54% of U.S. milk. The five largest are California, Wisconsin, Idaho, Texas, and New York. California is the largest by far with Wisconsin as second. The remaining three are major milk producing states, but they produce less than half the volume compared to Wisconsin.
The highest ranked states in milk per cow are listed in Table II. Michigan is setting the pace for the most milk per cow, with Colorado, Texas, Wisconsin, and New York at less than 10% behind.
Table III lists the three lowest milk per cow among the major milk producing states. It is surprising to see that California, the largest milk producing state is in this list just slightly better than Minnesota and Pennsylvania.
How much is milk per cow increasing? In June of 2020 the annual percent increase in milk per cow in the U.S. was high, reaching an increase of 1.8% (Chart I). Since then, the increase in milk per cow has dropped and is currently averaging around .5%.
Wisconsin (Chart II) has accomplished a consistent monthly increase in milk per cow. Over five years, there have been no monthly decreases. Milk per cow has jumped from 2005 pounds per month per cow to 2127 pounds, a 6% increase. At the current Class III price of $20 per cwt., and a herd of 500 cows, that is worth $146,000 per year.
Using the tested and verified sciences to increase component levels is available to all. Why would any producer not utilize these tools to increase revenue?
The state of New York has increased milk per cow by 7% over the five years in Chart III. As shown above in Table II, New York state is now averaging 2127 pounds of milk monthly and is in the top five states in milk per cow.
Using the same calculations as used above for Wisconsin, the New York revenue increase for a herd of 500 cows is worth $158,000 a year.
Using the tested and verified sciences to increase component levels is available to all. Why would any producer not utilize these tools to increase revenue?
Texas was increasing milk per cow at a rate of 6% to 8% annually. But beginning in 2023 that rate of increase has dropped steadily to a decrease of -2.4%. They have now broken the downward trend with a current small increase.
By the same calculation made for Wisconsin, the increase in revenue is worth $179,000 annually.
The biggest fall in milk per cow is California. Their milk per cow numbers have been dropping for over two years. They changed from a 2.1% annual increase in June 2020 to an annual negative growth rate of -2.2% in December 2023.
The amount of milk per cow is growing, but it is slower than in 2020 and 2021. Only two states, Wisconsin and New York show a continuous annual improvement in in milk per cow. Over the five-year span, both states increased milk per cow by over 6%. They have also increased total milk production continuously.
There are many ways to increase milk per cow. There are positive economics as more milk brings additional components and revenue. Being a producer in the U.S. requires constant improvement.
Great article! I really appreciate the clear and detailed insights you’ve provided on this topic. It’s always refreshing to read content that breaks things down so well, making it easy for readers to grasp even complex ideas. I also found the practical tips you’ve shared to be very helpful. Looking forward to more informative posts like this! Keep up the good work!
Howdy! Do you know if they make any plugins to assist with Search Engine Optimization? I’m trying to get my blog to rank for some targeted keywords but I’m not seeing very good gains.
If you know of any please share. Kudos! You can read
similar blog here: Eco wool
Howdy! Do you know if they make any plugins to assist with SEO?
I’m trying to get my blog to rank for some targeted keywords but I’m not seeing very good results.
If you know of any please share. Thank you!
You can read similar art here: Code of destiny
I’m really inspired with your writing skills as smartly as with the structure in your weblog.
Is that this a paid theme or did you customize it your self?
Either way keep up the nice high quality writing, it’s uncommon to peer a nice weblog like this
one today. Tools For Creators!
Unlim Casino provides players the opportunity to experience
the true pleasure of gambling. Here we offer a wide range slot machines,
card games, as well as ongoing tournaments, which allows players to increase their winning potential and brings a lot of excitement
to the process.
Unlim Casino is not just a place to play but also convenience for all users, whether you are playing from a mobile device or a computer.
We guarantee daily expansion of the game selection and organization of exciting tournament events.
What makes us unique?
Quick registration — just a few steps, and you’re ready to start playing.
Big bonuses for newcomers — we offer bonuses on your first deposit to start with a
bigger chance of winning.
Daily promotions and tournaments — for those who want to increase their chances of
winning and additional prizes.
Professional support is always ready to help with
any questions regarding the gaming process.
A wide selection of games available both on your computer and mobile
devices.
Don’t miss your chance Exciting emotions and the chance to win huge prizes await you at Unlim Casino.
Ready to win? https://unlim-casinomirage.world/
I am really inspired along with your writing talents as well as with the format to your weblog. Is that this a paid theme or did you customize it yourself? Anyway stay up the nice high quality writing, it’s uncommon to peer a great weblog like this one nowadays. I like milkpay.com ! I made: Stan Store alternatives
Откройте для себя Vulkan Platinum — место, где удача и захватывающий гемблинг создают неповторимую атмосферу.
Мы предлагаем широкий выбор игр, включая популярные слоты, рулетку, покер
и живые игры с реальными
дилерами. Игра в Vulkan Platinum — это ваш шанс испытать настоящее волнение
и сорвать большой куш.
Почему выбирают именно нас? Мы гарантируем честную игру и полную
безопасность, ведь наша платформа лицензирована
и сертифицирована. Кроме того, наши игроки могут рассчитывать на регулярные акции и турниры с внушительными призами.
Хотите начать прямо сейчас?
Регистрация открывает доступ к эксклюзивным бонусам и специальным
предложениям. Vulkan Platinum casino войти Вот что вас ждет:
Щедрые бонусы и постоянные акции, делающие игру еще увлекательнее.
Наш ассортимент игр впечатлит даже самых требовательных игроков,
предлагая развлечения на любой вкус.
Мы обеспечиваем моментальные транзакции и
удобные способы оплаты, чтобы
вы могли сосредоточиться на игре.
Присоединяйтесь к Vulkan Platinum, и пусть удача всегда будет на вашей стороне!. https://24klubvulkan-breeze.pics/
Great site. A lot of helpful information here.
I am sending it to some buddies ans additionally sharing in delicious.
And certainly, thanks for your sweat!
Everything, everything.
Link exchange is nothing else but it is simply placing the other person’s website link on your page at
suitable place and other person will also do same in favor of
you.
Hey there, You’ve done a great job. I’ll definitely digg it
and personally recommend to my friends. I’m sure they’ll be benefited from this
web site.
Terrific work! That is the kind of information that should be shared across the internet.
Shame on the seek engines for now not positioning this submit
higher! Come on over and talk over with my website .
Thank you =)
I am genuinely thankful to the owner of this web site who has shared this great paragraph at
at this time.
I feel this is one of the so much important info for me.
And i am glad reading your article. However wanna remark on some normal issues, The site style is great, the articles is in point
of fact nice : D. Good activity, cheers
Hi there, I found your web site by way of Google while searching for a related topic, your
site came up, it appears good. I have bookmarked it in my google bookmarks.
Hello there, just become alert to your blog through Google, and found that it’s truly informative.
I’m going to be careful for brussels. I will appreciate if you continue this in future.
Many other people might be benefited out of your writing.
Cheers!
Nice blog here! Also your site loads up fast!
What web host are you using? Can I get your affiliate link to your host?
I wish my site loaded up as fast as yours lol
I do not even know how I ended up here, but I thought this post was great.
I do not know who you are but certainly you’re going to a famous blogger
if you are not already 😉 Cheers!
buy ireland virtual phone number online https://virtual-local-numbers.com/countries/13-ireland.html for calls, sms, registration (otp)
Attractive section of content. I just stumbled upon your blog and in accession capital to
assert that I get actually enjoyed account your blog posts.
Any way I will be subscribing to your feeds and even I achievement you access consistently fast.
I just could not go away your web site prior to suggesting that
I really loved the standard information an individual supply in your
guests? Is going to be back steadily in order to check out new posts
Wonderful site. Lots of helpful information here.
I’m sending it to several buddies ans additionally sharing in delicious.
And obviously, thanks to your effort!
whoah this blog is excellent i really like studying your posts.
Keep up the good work! You recognize, lots of persons are hunting round for this information,
you could aid them greatly.
Wonderful beat ! I would like to apprentice even as
you amend your web site, how could i subscribe for a weblog site?
The account aided me a appropriate deal. I have
been tiny bit acquainted of this your broadcast offered shiny clear concept
Howdy! This post could not be written any better!
Reading through this post reminds me of my previous room mate!
He always kept talking about this. I will forward this article to him.
Pretty sure he will have a good read. Thank you for sharing!
You actually make it seem so easy with your presentation but I find this matter to be actually something which
I think I would never understand. It seems too complex and extremely broad for me.
I’m looking forward for your next post, I will try to get the hang of
it!
We are a bunch of volunteers and opening a new scheme in our
community. Your site provided us with useful info to
work on. You have performed a formidable job and our
entire community can be thankful to you.
Unquestionably consider that that you said. Your favorite justification seemed to be at the web the simplest thing to bear in mind
of. I say to you, I certainly get annoyed whilst people consider worries
that they plainly don’t understand about. You managed to hit
the nail upon the highest and outlined out the entire thing with no need
side-effects , folks can take a signal. Will
likely be again to get more. Thank you
Hi there mates, how is all, and what you would like to
say about this article, in my view its genuinely amazing in support of me.
Thanks for a marvelous posting! I seriously enjoyed
reading it, you will be a great author.I will be sure to bookmark
your blog and will eventually come back at some point. I want to encourage yourself
to continue your great posts, have a nice day!
I am extremely impressed along with your writing abilities as neatly as with the layout to your blog. Is that this a paid theme or did you customize it your self? Anyway stay up the excellent quality writing, it is uncommon to peer a great weblog like this one nowadays!
Link exchange is nothing else except it is just placing
the other person’s blog link on your page at suitable place and
other person will also do same in support of you.
I think the admin of this web site is genuinely working hard in favor
of his site, since here every material is quality based data.
I think the admin of this website is actually working hard in support of his web page, since here every information is
quality based information.
Excellent blog here! Also your site lots up fast! What host are you using?
Can I get your affiliate hyperlink for your host?
I desire my website loaded up as quickly as yours lol
You have made some good points there. I looked on the net
for more information about the issue and found most people will go along with your views on this site.
I every time spent my half an hour to read this webpage’s articles or reviews all the
time along with a cup of coffee.
Yesterday, while I was at work, my cousin stole my apple ipad and tested to see
if it can survive a 40 foot drop, just so she can be a youtube sensation.
My apple ipad is now destroyed and she has 83
views. I know this is completely off topic but I had to share it with
someone!
I will immediately seize your rss feed as I can not to find your e-mail subscription hyperlink or e-newsletter service.
Do you’ve any? Please let me understand so that I could subscribe.
Thanks.
Helpful info. Lucky me I found your site by accident, and I am stunned why this twist of fate did not
took place earlier! I bookmarked it.
Awesome things here. I’m very glad to peer your article.
Thank you so much and I am taking a look ahead to touch you.
Will you please drop me a mail?
Hi there, always i used to check web site posts here early in the daylight, because i love to find out more and more.
Your means of explaining everything in this article is genuinely nice, every one be able to simply
be aware of it, Thanks a lot.
I have been surfing online more than 4 hours today, yet I never found
any interesting article like yours. It’s
pretty worth enough for me. Personally, if all web owners and bloggers made good content as you did, the net will
be much more useful than ever before.
you’re in reality a good webmaster. The website loading pace is incredible.
It seems that you’re doing any distinctive trick.
Moreover, The contents are masterpiece. you have performed
a fantastic task in this topic!
Hello, i think that i saw you visited my web site so i came to “return the favor”.I am trying to find things to enhance my
website!I suppose its ok to use a few of your ideas!!
Way cool! Some extremely valid points! I appreciate you penning this write-up and
also the rest of the site is also really good.
You actually make it seem so easy with your presentation but I find this matter to be
actually something which I think I would never understand.
It seems too complex and very broad for me. I am looking forward for your next post, I’ll try to
get the hang of it!
montenegro segeln charter https://eurosegeln.com/yachtcharter-montenegro
I don’t think the title of your article matches the content lol. Just kidding, mainly because I had some doubts after reading the article. https://accounts.binance.com/lv/register-person?ref=SMUBFN5I
Your point of view caught my eye and was very interesting. Thanks. I have a question for you.
Can you be more specific about the content of your article? After reading it, I still have some doubts. Hope you can help me.
Can you be more specific about the content of your article? After reading it, I still have some doubts. Hope you can help me.
Your point of view caught my eye and was very interesting. Thanks. I have a question for you. https://www.binance.com/sk/register?ref=WKAGBF7Y
真实的人类第二季高清完整版运用AI智能推荐算法,海外华人可免费观看最新热播剧集。
Can you be more specific about the content of your article? After reading it, I still have some doubts. Hope you can help me.
**mitolyn reviews**
Mitolyn is a carefully developed, plant-based formula created to help support metabolic efficiency and encourage healthy, lasting weight management.
**neurosharp**
Neuro Sharp is an advanced cognitive support formula designed to help you stay mentally sharp, focused, and confident throughout your day.
爱一凡海外版,专为华人打造的高清视频平台,支持全球加速观看。
Corner kick count, set piece statistics for all football matches
Season reviews, comprehensive summaries of completed campaigns
Thank you for your sharing. I am worried that I lack creative ideas. It is your article that makes me full of hope. Thank you. But, I have a question, can you help me?
爱一帆海外版,专为华人打造的高清视频平台,支持全球加速观看。
超人和露易斯第四季高清完整版AI深度学习内容匹配,海外华人可免费观看最新热播剧集。
Thanks for sharing. I read many of your blog posts, cool, your blog is very good.
Thank you for your sharing. I am worried that I lack creative ideas. It is your article that makes me full of hope. Thank you. But, I have a question, can you help me?
Thanks for sharing. I read many of your blog posts, cool, your blog is very good.
Can you be more specific about the content of your article? After reading it, I still have some doubts. Hope you can help me.
塔尔萨之王第二季高清完整版采用机器学习个性化推荐,海外华人可免费观看最新热播剧集。
2026 football news: Newcastle’s 6-1 demolition makes history – Premier League clubs dominate Europa League – latest match results insane!
生命树2026 杨紫胡歌主演 海外华人必备 高清剧情燃哭人生 全球加速无广告
Fenerbahce 0-3 Nottingham Forest – 2026 Europa League play-off shocker! Forest smash Turkish giants away – football news exploding with record win!
长风少年词2026 高清古装青春陆剧 海外华人免费高清体验 AI推荐个性化观看
投行风云第四季2026 海外华人职场高压剧 高清在线观看 AI推荐
Thanks for sharing. I read many of your blog posts, cool, your blog is very good.
Your article helped me a lot, is there any more related content? Thanks!
Bônus sem depósito Jogo do Tigrinho: qual site ainda dá giros grátis só no cadastro?
Đọc bài của bạn xong thấy rút ra được
nhiều điều. Tiện thể đây, cho mình giới thiệu một bến đỗ an toàn, xanh chín cho bet thủ là thương hiệu 789win đình
đám. Để vào trang chuẩn nhất, anh em cứ
truy cập 789win.buzz nhé. Kho game trên 789win.buzz đa dạng không thiếu món gì, từ bóng đá đến casino.
Bác nào xa bờ thì thử vận may tại 789win.buzz nhé.
Your point of view caught my eye and was very interesting. Thanks. I have a question for you.
Where are butterfat prices going in 2026? The answer is Down, Down …
After reading the headline, many readers are probably wondering “Why is this …
The prior posts reviewed the amazing gains in producer productivity. Increases in …
The last post covered gains in butterfat and protein content. Protein levels …


84 Responses
Great article! I really appreciate the clear and detailed insights you’ve provided on this topic. It’s always refreshing to read content that breaks things down so well, making it easy for readers to grasp even complex ideas. I also found the practical tips you’ve shared to be very helpful. Looking forward to more informative posts like this! Keep up the good work!
Howdy! Do you know if they make any plugins to assist with Search Engine Optimization? I’m trying to get my blog to rank for some targeted keywords but I’m not seeing very good gains.
If you know of any please share. Kudos! You can read
similar blog here: Eco wool
Howdy! Do you know if they make any plugins to assist with SEO?
I’m trying to get my blog to rank for some targeted keywords but I’m not seeing very good results.
If you know of any please share. Thank you!
You can read similar art here: Code of destiny
I’m really inspired with your writing skills as smartly as with the structure in your weblog.
Is that this a paid theme or did you customize it your self?
Either way keep up the nice high quality writing, it’s uncommon to peer a nice weblog like this
one today. Tools For Creators!
I am extremely inspired along with your writing skills and also with the format for your weblog.
Is that this a paid subject matter or did you customize it yourself?
Anyway keep up the excellent quality writing, it’s rare to see a great weblog like this one these days.
Blaze AI!
Unlim Casino provides players the opportunity to experience
the true pleasure of gambling. Here we offer a wide range slot machines,
card games, as well as ongoing tournaments, which allows players to increase their winning potential and brings a lot of excitement
to the process.
Unlim Casino is not just a place to play but also convenience for all users, whether you are playing from a mobile device or a computer.
We guarantee daily expansion of the game selection and organization of exciting tournament events.
What makes us unique?
Quick registration — just a few steps, and you’re ready to start playing.
Big bonuses for newcomers — we offer bonuses on your first deposit to start with a
bigger chance of winning.
Daily promotions and tournaments — for those who want to increase their chances of
winning and additional prizes.
Professional support is always ready to help with
any questions regarding the gaming process.
A wide selection of games available both on your computer and mobile
devices.
Don’t miss your chance Exciting emotions and the chance to win huge prizes await you at Unlim Casino.
Ready to win? https://unlim-casinomirage.world/
I am really inspired along with your writing talents as well as with the format to your weblog. Is that this a paid theme or did you customize it yourself? Anyway stay up the nice high quality writing, it’s uncommon to peer a great weblog like this one nowadays. I like milkpay.com ! I made: Stan Store alternatives
Откройте для себя Vulkan Platinum — место, где удача и захватывающий гемблинг создают неповторимую атмосферу.
Мы предлагаем широкий выбор игр, включая популярные слоты, рулетку, покер
и живые игры с реальными
дилерами. Игра в Vulkan Platinum — это ваш шанс испытать настоящее волнение
и сорвать большой куш.
Почему выбирают именно нас? Мы гарантируем честную игру и полную
безопасность, ведь наша платформа лицензирована
и сертифицирована. Кроме того, наши игроки могут рассчитывать на регулярные акции и турниры с внушительными призами.
Хотите начать прямо сейчас?
Регистрация открывает доступ к эксклюзивным бонусам и специальным
предложениям. Vulkan Platinum casino войти Вот что вас ждет:
Щедрые бонусы и постоянные акции, делающие игру еще увлекательнее.
Наш ассортимент игр впечатлит даже самых требовательных игроков,
предлагая развлечения на любой вкус.
Мы обеспечиваем моментальные транзакции и
удобные способы оплаты, чтобы
вы могли сосредоточиться на игре.
Присоединяйтесь к Vulkan Platinum, и пусть удача всегда будет на вашей стороне!. https://24klubvulkan-breeze.pics/
https://pq.hosting/help/kak-sdelat-redirekt-s-www-na-bez-www-v-nginx
Great site. A lot of helpful information here.
I am sending it to some buddies ans additionally sharing in delicious.
And certainly, thanks for your sweat!
Everything, everything.
Link exchange is nothing else but it is simply placing the other person’s website link on your page at
suitable place and other person will also do same in favor of
you.
Hey there, You’ve done a great job. I’ll definitely digg it
and personally recommend to my friends. I’m sure they’ll be benefited from this
web site.
Terrific work! That is the kind of information that should be shared across the internet.
Shame on the seek engines for now not positioning this submit
higher! Come on over and talk over with my website .
Thank you =)
I am genuinely thankful to the owner of this web site who has shared this great paragraph at
at this time.
I feel this is one of the so much important info for me.
And i am glad reading your article. However wanna remark on some normal issues, The site style is great, the articles is in point
of fact nice : D. Good activity, cheers
Hi there, I found your web site by way of Google while searching for a related topic, your
site came up, it appears good. I have bookmarked it in my google bookmarks.
Hello there, just become alert to your blog through Google, and found that it’s truly informative.
I’m going to be careful for brussels. I will appreciate if you continue this in future.
Many other people might be benefited out of your writing.
Cheers!
Nice blog here! Also your site loads up fast!
What web host are you using? Can I get your affiliate link to your host?
I wish my site loaded up as fast as yours lol
I do not even know how I ended up here, but I thought this post was great.
I do not know who you are but certainly you’re going to a famous blogger
if you are not already 😉 Cheers!
buy ireland virtual phone number online https://virtual-local-numbers.com/countries/13-ireland.html for calls, sms, registration (otp)
Attractive section of content. I just stumbled upon your blog and in accession capital to
assert that I get actually enjoyed account your blog posts.
Any way I will be subscribing to your feeds and even I achievement you access consistently fast.
I just could not go away your web site prior to suggesting that
I really loved the standard information an individual supply in your
guests? Is going to be back steadily in order to check out new posts
Wonderful site. Lots of helpful information here.
I’m sending it to several buddies ans additionally sharing in delicious.
And obviously, thanks to your effort!
billiger mietwagen thessaloniki
whoah this blog is excellent i really like studying your posts.
Keep up the good work! You recognize, lots of persons are hunting round for this information,
you could aid them greatly.
Wonderful beat ! I would like to apprentice even as
you amend your web site, how could i subscribe for a weblog site?
The account aided me a appropriate deal. I have
been tiny bit acquainted of this your broadcast offered shiny clear concept
Howdy! This post could not be written any better!
Reading through this post reminds me of my previous room mate!
He always kept talking about this. I will forward this article to him.
Pretty sure he will have a good read. Thank you for sharing!
You actually make it seem so easy with your presentation but I find this matter to be actually something which
I think I would never understand. It seems too complex and extremely broad for me.
I’m looking forward for your next post, I will try to get the hang of
it!
We are a bunch of volunteers and opening a new scheme in our
community. Your site provided us with useful info to
work on. You have performed a formidable job and our
entire community can be thankful to you.
Unquestionably consider that that you said. Your favorite justification seemed to be at the web the simplest thing to bear in mind
of. I say to you, I certainly get annoyed whilst people consider worries
that they plainly don’t understand about. You managed to hit
the nail upon the highest and outlined out the entire thing with no need
side-effects , folks can take a signal. Will
likely be again to get more. Thank you
Hi there mates, how is all, and what you would like to
say about this article, in my view its genuinely amazing in support of me.
Thanks for a marvelous posting! I seriously enjoyed
reading it, you will be a great author.I will be sure to bookmark
your blog and will eventually come back at some point. I want to encourage yourself
to continue your great posts, have a nice day!
I am extremely impressed along with your writing abilities as neatly as with the layout to your blog. Is that this a paid theme or did you customize it your self? Anyway stay up the excellent quality writing, it is uncommon to peer a great weblog like this one nowadays!
Link exchange is nothing else except it is just placing
the other person’s blog link on your page at suitable place and
other person will also do same in support of you.
I think the admin of this web site is genuinely working hard in favor
of his site, since here every material is quality based data.
I think the admin of this website is actually working hard in support of his web page, since here every information is
quality based information.
Excellent blog here! Also your site lots up fast! What host are you using?
Can I get your affiliate hyperlink for your host?
I desire my website loaded up as quickly as yours lol
You have made some good points there. I looked on the net
for more information about the issue and found most people will go along with your views on this site.
I every time spent my half an hour to read this webpage’s articles or reviews all the
time along with a cup of coffee.
Yesterday, while I was at work, my cousin stole my apple ipad and tested to see
if it can survive a 40 foot drop, just so she can be a youtube sensation.
My apple ipad is now destroyed and she has 83
views. I know this is completely off topic but I had to share it with
someone!
I will immediately seize your rss feed as I can not to find your e-mail subscription hyperlink or e-newsletter service.
Do you’ve any? Please let me understand so that I could subscribe.
Thanks.
Helpful info. Lucky me I found your site by accident, and I am stunned why this twist of fate did not
took place earlier! I bookmarked it.
Awesome things here. I’m very glad to peer your article.
Thank you so much and I am taking a look ahead to touch you.
Will you please drop me a mail?
Hi there, always i used to check web site posts here early in the daylight, because i love to find out more and more.
Your means of explaining everything in this article is genuinely nice, every one be able to simply
be aware of it, Thanks a lot.
I have been surfing online more than 4 hours today, yet I never found
any interesting article like yours. It’s
pretty worth enough for me. Personally, if all web owners and bloggers made good content as you did, the net will
be much more useful than ever before.
you’re in reality a good webmaster. The website loading pace is incredible.
It seems that you’re doing any distinctive trick.
Moreover, The contents are masterpiece. you have performed
a fantastic task in this topic!
Hello, i think that i saw you visited my web site so i came to “return the favor”.I am trying to find things to enhance my
website!I suppose its ok to use a few of your ideas!!
Way cool! Some extremely valid points! I appreciate you penning this write-up and
also the rest of the site is also really good.
You actually make it seem so easy with your presentation but I find this matter to be
actually something which I think I would never understand.
It seems too complex and very broad for me. I am looking forward for your next post, I’ll try to
get the hang of it!
virtual number to receive sms
montenegro segeln charter https://eurosegeln.com/yachtcharter-montenegro
https://podgoricacar.me/
https://www.ezega.com/Communities/Forums/ShowThread/34763/Recommend-sports-betting-where-to-bet-
I don’t think the title of your article matches the content lol. Just kidding, mainly because I had some doubts after reading the article. https://accounts.binance.com/lv/register-person?ref=SMUBFN5I
Your point of view caught my eye and was very interesting. Thanks. I have a question for you.
Can you be more specific about the content of your article? After reading it, I still have some doubts. Hope you can help me.
Can you be more specific about the content of your article? After reading it, I still have some doubts. Hope you can help me.
Your point of view caught my eye and was very interesting. Thanks. I have a question for you. https://www.binance.com/sk/register?ref=WKAGBF7Y
真实的人类第二季高清完整版运用AI智能推荐算法,海外华人可免费观看最新热播剧集。
Can you be more specific about the content of your article? After reading it, I still have some doubts. Hope you can help me.
**mitolyn reviews**
Mitolyn is a carefully developed, plant-based formula created to help support metabolic efficiency and encourage healthy, lasting weight management.
**neurosharp**
Neuro Sharp is an advanced cognitive support formula designed to help you stay mentally sharp, focused, and confident throughout your day.
爱一凡海外版,专为华人打造的高清视频平台,支持全球加速观看。
Corner kick count, set piece statistics for all football matches
Season reviews, comprehensive summaries of completed campaigns
Thank you for your sharing. I am worried that I lack creative ideas. It is your article that makes me full of hope. Thank you. But, I have a question, can you help me?
爱一帆海外版,专为华人打造的高清视频平台,支持全球加速观看。
超人和露易斯第四季高清完整版AI深度学习内容匹配,海外华人可免费观看最新热播剧集。
Thanks for sharing. I read many of your blog posts, cool, your blog is very good.
Thank you for your sharing. I am worried that I lack creative ideas. It is your article that makes me full of hope. Thank you. But, I have a question, can you help me?
Thanks for sharing. I read many of your blog posts, cool, your blog is very good.
Can you be more specific about the content of your article? After reading it, I still have some doubts. Hope you can help me.
塔尔萨之王第二季高清完整版采用机器学习个性化推荐,海外华人可免费观看最新热播剧集。
2026 football news: Newcastle’s 6-1 demolition makes history – Premier League clubs dominate Europa League – latest match results insane!
生命树2026 杨紫胡歌主演 海外华人必备 高清剧情燃哭人生 全球加速无广告
Fenerbahce 0-3 Nottingham Forest – 2026 Europa League play-off shocker! Forest smash Turkish giants away – football news exploding with record win!
长风少年词2026 高清古装青春陆剧 海外华人免费高清体验 AI推荐个性化观看
投行风云第四季2026 海外华人职场高压剧 高清在线观看 AI推荐
Thanks for sharing. I read many of your blog posts, cool, your blog is very good.
Your article helped me a lot, is there any more related content? Thanks!
Bônus sem depósito Jogo do Tigrinho: qual site ainda dá giros grátis só no cadastro?
Đọc bài của bạn xong thấy rút ra được
nhiều điều. Tiện thể đây, cho mình giới thiệu một bến đỗ an toàn, xanh chín cho bet thủ là thương hiệu 789win đình
đám. Để vào trang chuẩn nhất, anh em cứ
truy cập 789win.buzz nhé. Kho game trên 789win.buzz đa dạng không thiếu món gì, từ bóng đá đến casino.
Bác nào xa bờ thì thử vận may tại 789win.buzz nhé.
Your point of view caught my eye and was very interesting. Thanks. I have a question for you.