This is Part IV of “Making Money.” The three prior posts are listed below with links to the content.
- Part I – Making Money – Butterfat and Protein Components
- Part II – Making Money – Milk per Cow
- Part III – Making Money – Somatic Cell Counts
This post will cover the bottom line, what a producer is really paid. That number is the “Statistical Uniform Price.” The first payment in the eight Federal Orders paid on the Class and component formulas is based on the content value of butterfat, protein, and other solids. The second payment is Producer Price Differential which covers the difference between what was paid on the first payment to producers and the weighted value based on the use of the milk. Payment on the “Advanced” system is made up of a partial payment when the milk is delivered and a final payment when the “Uniform Price” is determined.
Part I ranked Federal Orders by component levels and the Upper Midwest was near the top with a high level of butterfat. In Part II, Wisconsin, the largest dairy state in the Upper Midwest was highly ranked in milk per cow. In Part III, which covered Somatic Cell Counts (SCC), the Upper Midwest was ranked best with a low SCC.
In Part I and Part II, Florida was ranked at the bottom in terms of butterfat component levels and milk per cow.
TABLE I below ranks the 12 Federal Orders on their Statistical Uniform Price. The Upper Midwest has the lowest Uniform price which represents the payment to producers. Florida is ranked at the top of the list with the highest Uniform Price.
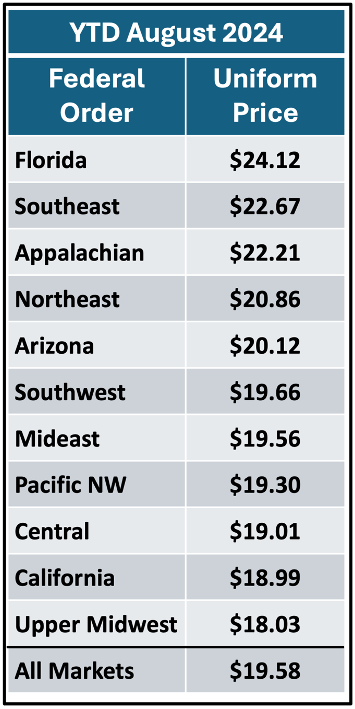
How can it be, that the Federal Order that has done the most to maximize revenue is at the bottom of the list in terms of the “Statistical Uniform Price” of actual payments? In fact, the four Federal Orders with the lowest butterfat component levels are at the top of the “Statistical Uniform Price” of the milk payment listing in Table I above.
The Uniform price is based on a weighted average of the value of milk in all four Classes of milk. Table II below shows the percentage of milk volume by class for each federal order. Those with over fifty percent in a single Class of milk are circled. The Federal Orders with the highest Class I milk for drinking are getting the highest pay. The ones with the highest volume of Class III milk for cheese hit the bottom of the list in terms of payment for their milk. Is Florida milk better than the Upper Midwest milk?

Table III shows the index Class values per cwt. for August. The Class I base gets location differentials added. In the case of Florida, that brings the Class I price to $23.29 per cwt. The Class III and Class IV prices are well below the Class I price.
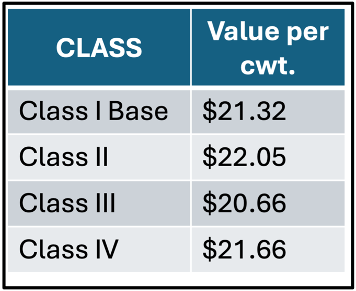
Is Class I milk better milk? Does there need to be a location adjustment to ensure that grocery stores have milk?
The next post will review butter and cheese prices, which have the largest impact on producer milk prices.


8 Responses
Willingly I accept. An interesting theme, I will take part. Together we can come to a right answer.
https://continent-telecom.com/virtual-number-telegram
https://virtual-local-numbers.com/countries/21-mexico.html
https://avenue17.ru/oborudovanie/hengda
You commit an error. I suggest it to discuss. Write to me in PM.
Exact phrase
https://1xbetlklogin.com/
Thanks for sharing. I read many of your blog posts, cool, your blog is very good. https://accounts.binance.com/es-AR/register-person?ref=UT2YTZSU