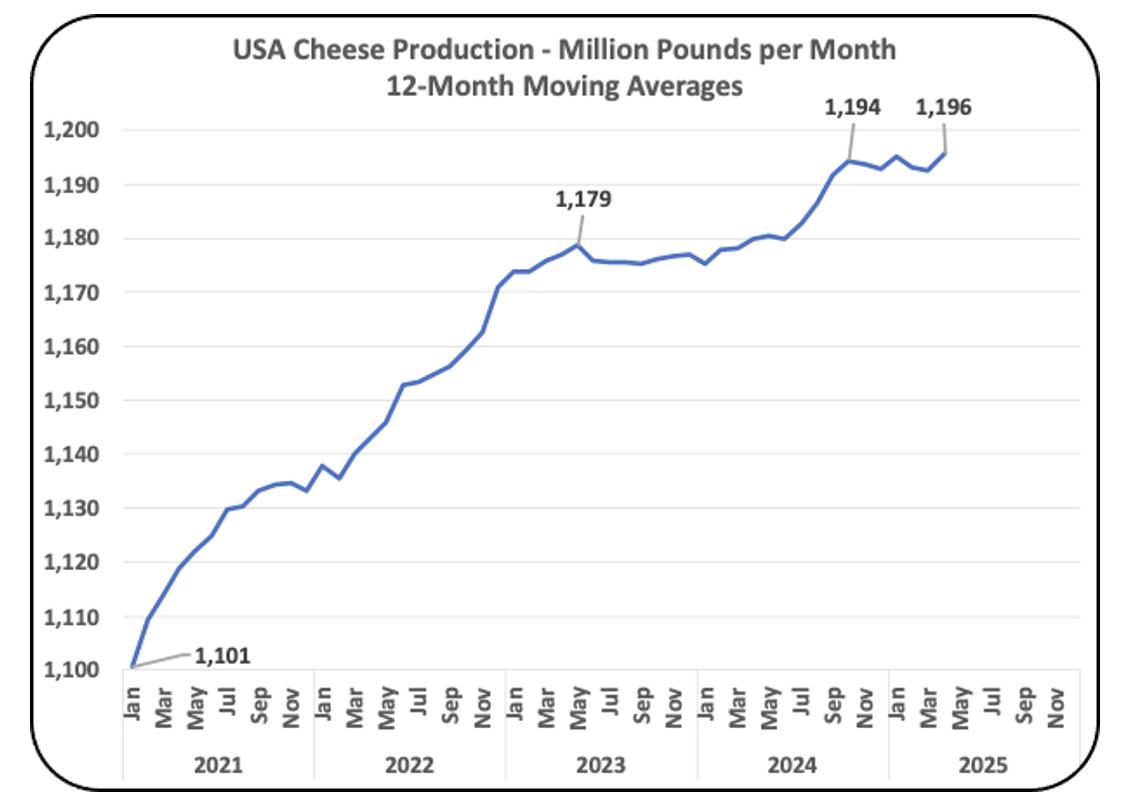


USA cheese production is stable but not growing (Chart I). For the last 8 months, production has been level. This post will examine where the growth is and where the offsetting losses are coming from. The seven highest producing states will be reviewed. These states account for over 70% of USA cheese production. The charts below are based on 12-month moving averages to minimize monthly variations.
USA CHEESE PRODUCTION
Cheese production in the USA grew by 2% to 3% annually in 2021 and 2022. It has now slowed and is showing no growth. Cheese exports have also shown no growth in 2025. (See this prior post for details.)
WISCONSIN CHEESE PRODUCTION
Wisconsin, Chart II, is by far the largest cheese-producing state with 25% of the total USA cheese production. The growth has been steady and consistent, and more growth can be expected. Annual growth has been as high as 3% and now growing at a rate of 1.5%. Over the course of Chart II, Wisconsin cheese production has increased by 22 million pounds per month.
CALIFORNIA CHEESE PRODUCTION
California is the second largest cheese producing state but has seen no growth and a slight decline since the start of 2024. In 2025, the decline has stopped but there is still no growth. California cheese production is following the path of butter with declining production.
IDAHO CHEESE PRODUCTION
Since 2023, cheese production in Idaho has grown consistently and is presently growing at 3.5% annually (Chart IV).
NEW MEXICO CHEESE PRODUCTION
New Mexico, Chart V, has seen a significant decline of 7 million pounds of cheese per month. Due to environmental issues the cow population has also decreased by 11% as covered in this post.
MINNESOTA CHEESE PRODUCTION
Minnesota has seen a slight decline in cheese production in the last two years (Chart VI).
NEW YORK CHEESE PRODUCTION
The state of New York is consistent and steady in most aspects of dairy production. This is also true for cheese production (Chart VII). It is presently producing 71 million pounds of cheese per month, the same as January of 2021.
SOUTH DAKOTA CHEESE PRODUCTION
South Dakota is ranked as the seventh largest cheese producing state. Over the course of Chart VIII, cheese production has grown by 20%. South Dakota has also seen the largest increase in number of cows (See this post for details).
SUMMARY
It is disappointing to see no 2025 growth in cheese production in the USA.
There are only five major dairy states with increased cheese production reaching new highs. Their gains over the five years in the above charts are listed below. The USA is up 95 million pounds per month
Wisconsin – Up 22 million pounds per month
South Dakota – Up 8 million pounds per month
Idaho – Up 2 million pounds per month
Pennsylvania – Up 2 million pounds per month
New Jersey – Up 2 million pounds per month
The remainder is made up from states with relatively smaller cheese production
Prior posts have focused on producer revenue from butterfat and milk protein …
The prior post showed that the producer price of butterfat is continuing …
Where are butterfat prices going in 2026? The answer is Down, Down …
After reading the headline, many readers are probably wondering “Why is this …