How Much has the Ratio of Milk Protein to Butterfat Changed?

How Much has the Ratio of Milk Protein to Butterfat Changed?

How to manage the Increase in butterfat is a prime topic.  We are short on butterfat for butter production, and we have excess butterfat for cheese making.  This post will cover the change in the protein to butterfat ratio in each of the Federal Orders over the last five years.  

The data for protein is available only for the seven Federal Orders paid by the Class and Component formulas.  The data covers only the milk processed in a Federal Order.  Data for de-pooled milk is not included.   There is some butterfat being moved from Class III milk for cheese to Class IV milk for butter.  Typically, the butterfat being moved is still included in the same Federal Order.

The increases in butterfat are based on money.  Butterfat has been in short supply which means the price in high.  Butterfat is priced on the price of butter only.  The high butterfat price provides a strong incentive to increase butterfat production.

The results of the protein to butterfat ratio are very consistent in the seven Federal Orders as covered below.  Chart I below shows the impact for all seven Federal Orders combined.  The ratio of protein to butterfat was 85% in 2021.  In 2025 it is down to 81% based on the increased production of butterfat.  That is not the ratio of protein to butterfat needed when the milk is processed into cheese.

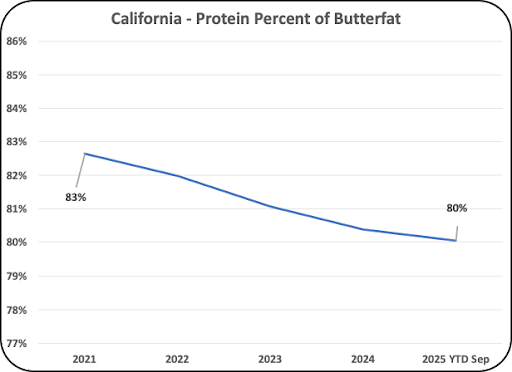
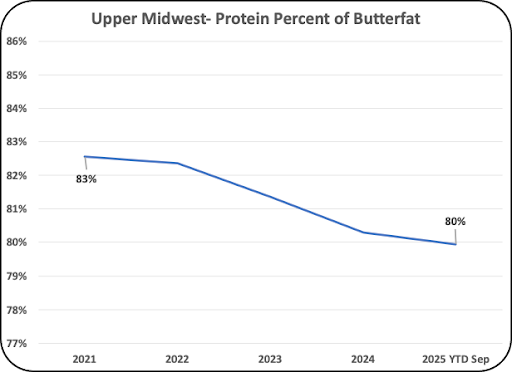
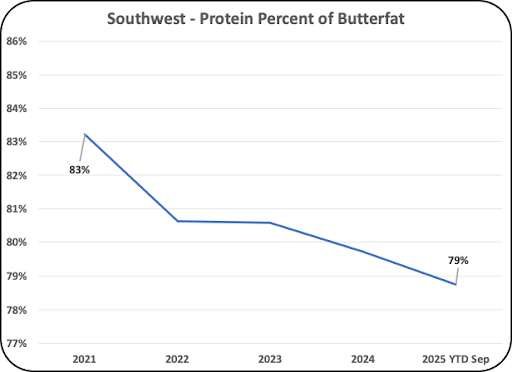
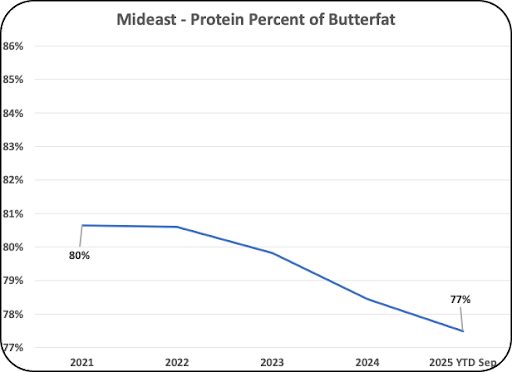
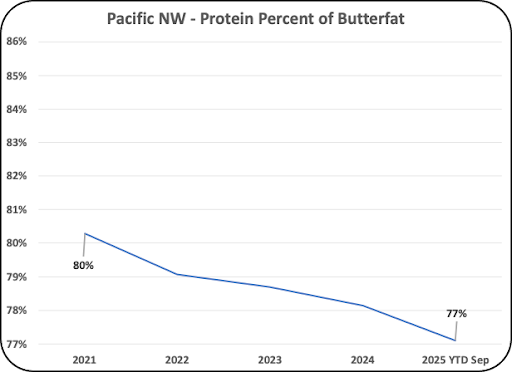
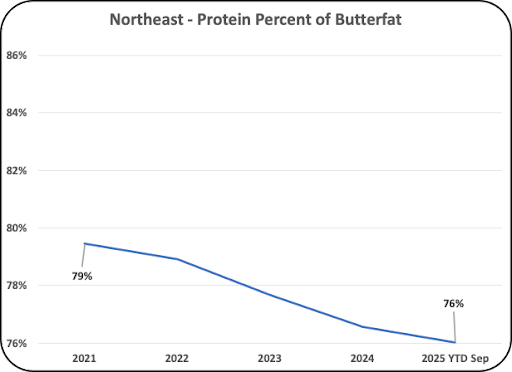
Below Chart I are charts for the seven Federal Orders analyzed.  The change is consistent at a 3% to 4% drop in this ratio of protein to butterfat which shows that butterfat production is growing faster that milk protein.  Butterfat, due to its high price is more valuable than the price of milk protein.

The change in the ratio of milk protein to butterfat is slowing down.  However, the low ratio still means that there is a need to move butterfat from Class III to Class IV.  Some of the slowdown in 2025 may be from the current movement of butterfat from Class III to Class IV.

The data for 2025 is based on the first three quarters of the year.  The fourth quarter always has the highest butterfat and milk protein components.  However, that should not influence the ratios below.
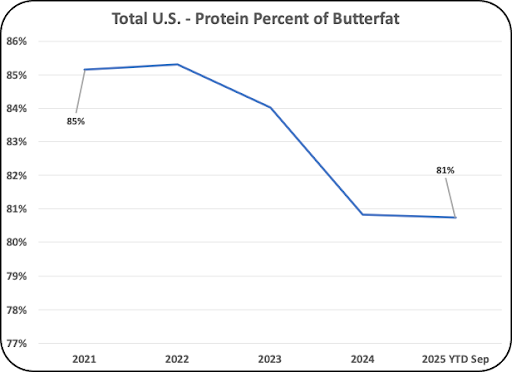
Chart I – U.S. Ratio of Milk Protein to Butterfat
Chart II – Central Federal Order Ratio of Milk Protein to Butterfat
Chart III – California Federal Order Ratio of Milk Protein to Butterfat
Chart IV – Upper Midwest Federal Order Ratio of Milk Protein to Butterfat
Chart V – Southwest Federal Order Ratio of Milk Protein to Butterfat
Chart VI – Mideast Federal Order Ratio of Milk Protein to Butterfat
Chart VII – Pacific Federal Order Ratio of Milk Protein to Butterfat
Chart VIII – Northeast Federal Order Ratio of Milk Protein to Butterfat

What would be the ideal future change in component gains?  As covered in a recent post to this site, cheese exports are climbing.  Butter exports are negligible.  There are two things that would help grow the dairy industry.  

  1. The first one would be an increase in milk protein to get a balance that would work for cheese making.
  2. The other is to keep butterfat production growing and find export locations that will pay a decent price for butterfat or butter.


Other recent posts are available at this link, and older posts are available at this link.

Subscribe via email

Get new posts by email:

This field is for validation purposes and should be left unchanged.

Cheese

Dry Whey

Cash prices - Butter / Cheese

FMMO Price Announcements

Resources

Blog Archive

How to manage the Increase in butterfat is a prime topic.  We are short on butterfat for butter production, and we have excess butterfat for cheese making.  This post will cover the change in the protein to butterfat ratio in each of the Federal Orders over the last five years.  

The data for protein is available only for the seven Federal Orders paid by the Class and Component formulas.  The data covers only the milk processed in a Federal Order.  Data for de-pooled milk is not included.   There is some butterfat being moved from Class III milk for cheese to Class IV milk for butter.  Typically, the butterfat being moved is still included in the same Federal Order.

The increases in butterfat are based on money.  Butterfat has been in short supply which means the price in high.  Butterfat is priced on the price of butter only.  The high butterfat price provides a strong incentive to increase butterfat production.

The results of the protein to butterfat ratio are very consistent in the seven Federal Orders as covered below.  Chart I below shows the impact for all seven Federal Orders combined.  The ratio of protein to butterfat was 85% in 2021.  In 2025 it is down to 81% based on the increased production of butterfat.  That is not the ratio of protein to butterfat needed when the milk is processed into cheese.

Below Chart I are charts for the seven Federal Orders analyzed.  The change is consistent at a 3% to 4% drop in this ratio of protein to butterfat which shows that butterfat production is growing faster that milk protein.  Butterfat, due to its high price is more valuable than the price of milk protein.

The change in the ratio of milk protein to butterfat is slowing down.  However, the low ratio still means that there is a need to move butterfat from Class III to Class IV.  Some of the slowdown in 2025 may be from the current movement of butterfat from Class III to Class IV.

The data for 2025 is based on the first three quarters of the year.  The fourth quarter always has the highest butterfat and milk protein components.  However, that should not influence the ratios below.
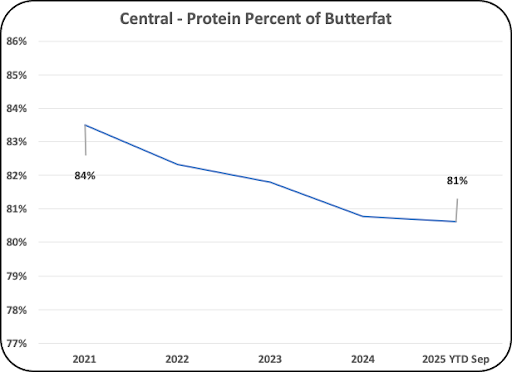
Chart I – U.S. Ratio of Milk Protein to Butterfat
Chart II – Central Federal Order Ratio of Milk Protein to Butterfat
Chart III – California Federal Order Ratio of Milk Protein to Butterfat
Chart IV – Upper Midwest Federal Order Ratio of Milk Protein to Butterfat
Chart V – Southwest Federal Order Ratio of Milk Protein to Butterfat
Chart VI – Mideast Federal Order Ratio of Milk Protein to Butterfat
Chart VII – Pacific Federal Order Ratio of Milk Protein to Butterfat
Chart VIII – Northeast Federal Order Ratio of Milk Protein to Butterfat

What would be the ideal future change in component gains?  As covered in a recent post to this site, cheese exports are climbing.  Butter exports are negligible.  There are two things that would help grow the dairy industry.  

  1. The first one would be an increase in milk protein to get a balance that would work for cheese making.
  2. The other is to keep butterfat production growing and find export locations that will pay a decent price for butterfat or butter.


Other recent posts are available at this link, and older posts are available at this link.

Subscribe via email

Get new posts by email:

This field is for validation purposes and should be left unchanged.

Cheese

Dry Whey

Cash prices - Butter / Cheese

FMMO Price Announcements

Resources

Blog Archive

New MilkPrice Resources

Check out our resources to learn more from MilkPrice!

How to manage the Increase in butterfat is a prime topic.  We …

The dairy industry is amazing in advancing technology to keep production profitable …

Retail inflation of the major dairy products was covered six months ago …

There is a lot of talk in the dairy industry concerning butterfat.  …

Latest Blog