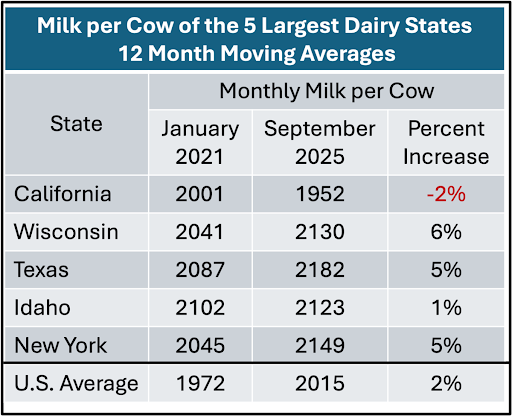
Five Largest Dairy Producing States


After reading the headline, many readers are probably wondering “Why is this …
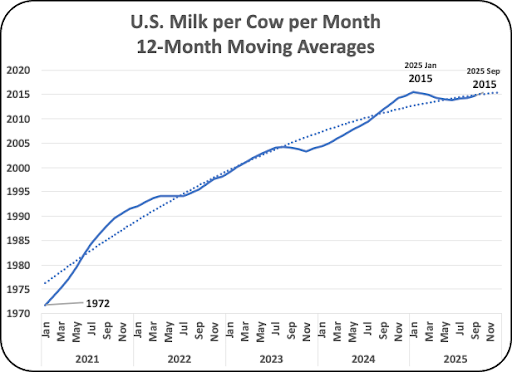
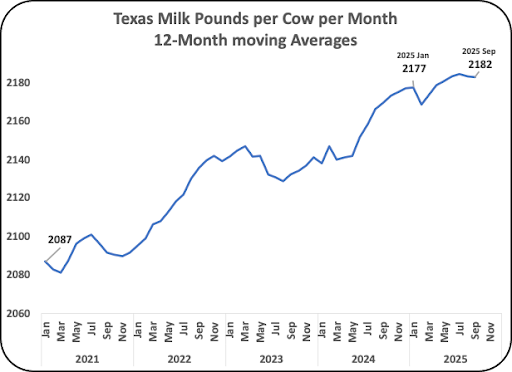
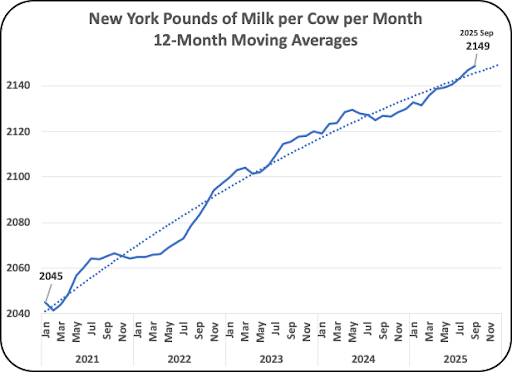
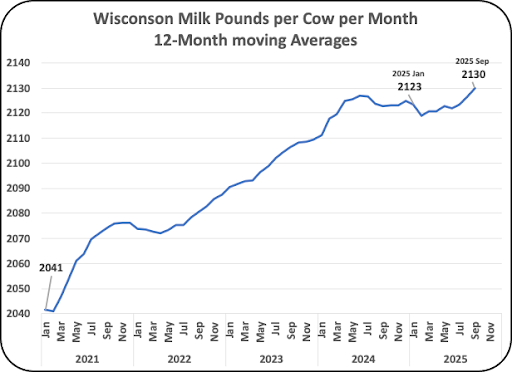
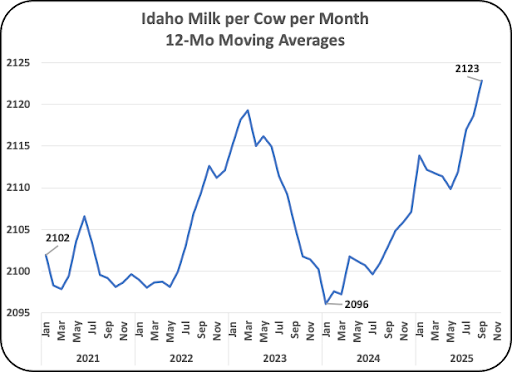
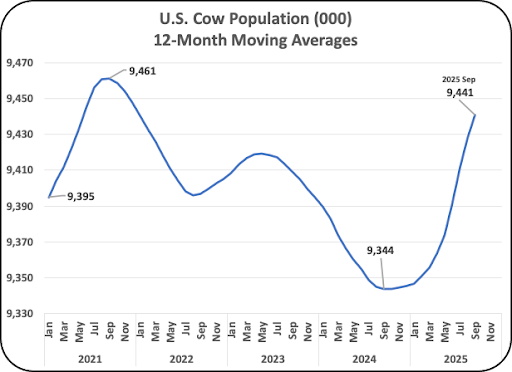
The prior posts reviewed the amazing gains in producer productivity. Increases in …
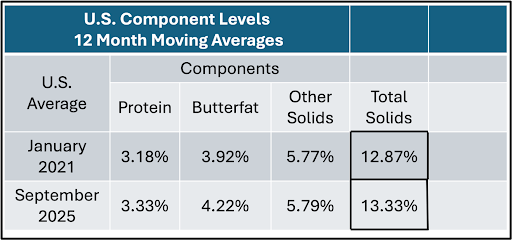
The last post covered gains in butterfat and protein content. Protein levels …
The prior four posts were mostly bad news for producers. Commodity prices, …