

Part I of this analysis covered the extreme volatility in producer milk prices. The volatility of income on dairy farms makes for difficult financial issues. Managing the extreme financial issues detracts from the implementation best practices.
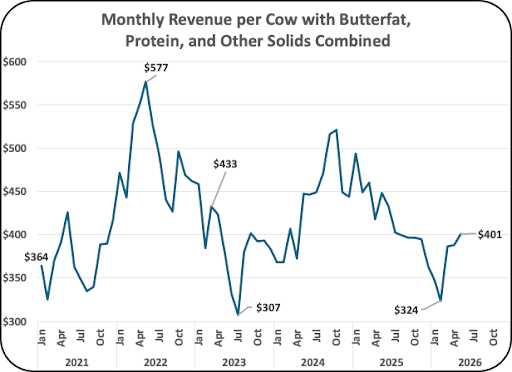
The final Chart in Part I is shown below. Every month the revenue changes. Between March 2023 and July 2023, the monthly revenue per cow changed from $433 to $307, a drop of 30%. That is a huge drop in revenue over the course of five months.
Farms have no warning of the drastic changes. It is not a seasonal fluctuation, and the payment changes come without any prior notice. That is like having a fluctuating paycheck that can change without warning at any time. How does a dairy operation manage this? Cash must come from some source like a significant cash fund held by the operation or a good banker with contracts to fill in the necessary low points. Other measures include changes in feed and other operating expenses. None of these allow for a smooth operating business.
What tools does a dairy farm have to improve revenue. There are many items to manage, but the charts below will focus on revenue improvements.
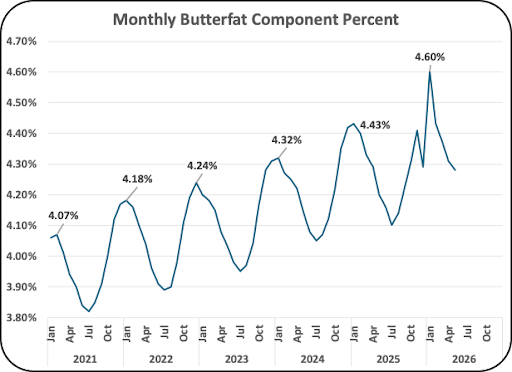
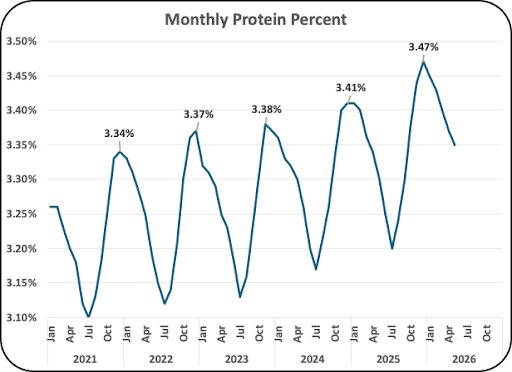
Charts II and III show the continuing success of increasing butterfat and protein percent. Over the course of this chart butterfat has grown by 13%. Protein has increased by 4%. Improving components requires a lot of changes, and some are expensive and must have a return on investment. It is not practical to change these practices monthly and the potential changes cannot look forward as the next month’s revenue is never known.
Nevertheless, the average butterfat and protein percents continue to improve steadily. If it were not for the volatility, the gains would probably be implemented more quickly and sustained over time. Additionally, new technologies would be implemented more quickly.
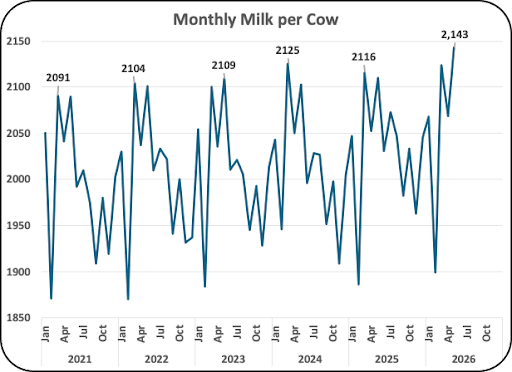
Milk per cow is also a growing practice with economic benefits. Due to dairy farm improvements the rate of growth of this practice is accelerating. The gains prior to 2025 were not as consistent as the gains in butterfat and protein increases. In 2025 and YTD 2026 the increases in milk per cow have been steady and are accelerating.
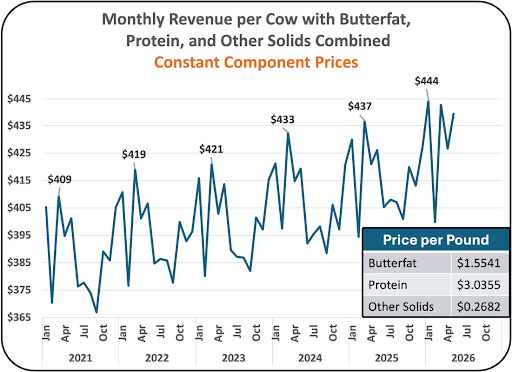
Chart V shows a hypothetical example where the USDA/AMS component prices don’t change. The volatility in Chart V is only influenced by the seasonal patterns. The seasonal patterns are volatile, but they are predictable. Keeping component prices static over six years is not a possibility, but it does show that the financial volatility is coming from the USDA/AMS pricing and processes.
What does that mean? It means that all the volatility is coming from the USDA pricing formulas and AMS processes. There is significant volatility in the wholesale prices used to price components.
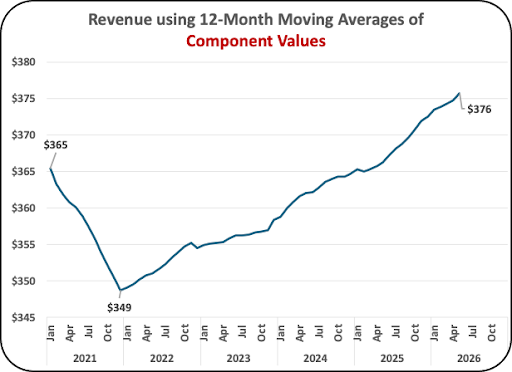
How can the USDA/AMS pricing be changed to reduce dairy farm volatility? Chart VI is an example of monthly revenue if rolling 12- month averages were used to price components. Currently, the Class and Component pricing process is based on weekly prices. The monthly data is based on weekly data composed of two 4-week periods and one 5-week period each quarter. The Advanced system is slightly different.
One way to reduce the monthly volatility is to use longer periods with rolling averages. Chart VI shows the USDA/AMS pricing if 12-month moving averages were used. The averages would have the prices from 52 weeks used as a rolling 52-week rolling average.
The monthly extreme volatility would be reduced as shown in Chart VI.
This post shows where the extreme volatility in monthly revenue for dairy farms is coming from. The farms are consistently making changes to reduce cost. Volatility in pricing slows this process. The examples used in Charts V and VI are only a theoretical solution. Other solutions to reduce volatility should be considered.
Part I of this analysis covered the extreme volatility in producer milk prices. The volatility of income on dairy farms makes for difficult financial issues. Managing the extreme financial issues detracts from the implementation best practices.
The final Chart in Part I is shown below. Every month the revenue changes. Between March 2023 and July 2023, the monthly revenue per cow changed from $433 to $307, a drop of 30%. That is a huge drop in revenue over the course of five months.
Farms have no warning of the drastic changes. It is not a seasonal fluctuation, and the payment changes come without any prior notice. That is like having a fluctuating paycheck that can change without warning at any time. How does a dairy operation manage this? Cash must come from some source like a significant cash fund held by the operation or a good banker with contracts to fill in the necessary low points. Other measures include changes in feed and other operating expenses. None of these allow for a smooth operating business.
What tools does a dairy farm have to improve revenue. There are many items to manage, but the charts below will focus on revenue improvements.
Charts II and III show the continuing success of increasing butterfat and protein percent. Over the course of this chart butterfat has grown by 13%. Protein has increased by 4%. Improving components requires a lot of changes, and some are expensive and must have a return on investment. It is not practical to change these practices monthly and the potential changes cannot look forward as the next month’s revenue is never known.
Nevertheless, the average butterfat and protein percents continue to improve steadily. If it were not for the volatility, the gains would probably be implemented more quickly and sustained over time. Additionally, new technologies would be implemented more quickly.
Milk per cow is also a growing practice with economic benefits. Due to dairy farm improvements the rate of growth of this practice is accelerating. The gains prior to 2025 were not as consistent as the gains in butterfat and protein increases. In 2025 and YTD 2026 the increases in milk per cow have been steady and are accelerating.
Chart V shows a hypothetical example where the USDA/AMS component prices don’t change. The volatility in Chart V is only influenced by the seasonal patterns. The seasonal patterns are volatile, but they are predictable. Keeping component prices static over six years is not a possibility, but it does show that the financial volatility is coming from the USDA/AMS pricing and processes.
What does that mean? It means that all the volatility is coming from the USDA pricing formulas and AMS processes. There is significant volatility in the wholesale prices used to price components.
How can the USDA/AMS pricing be changed to reduce dairy farm volatility? Chart VI is an example of monthly revenue if rolling 12- month averages were used to price components. Currently, the Class and Component pricing process is based on weekly prices. The monthly data is based on weekly data composed of two 4-week periods and one 5-week period each quarter. The Advanced system is slightly different.
One way to reduce the monthly volatility is to use longer periods with rolling averages. Chart VI shows the USDA/AMS pricing if 12-month moving averages were used. The averages would have the prices from 52 weeks used as a rolling 52-week rolling average.
The monthly extreme volatility would be reduced as shown in Chart VI.
This post shows where the extreme volatility in monthly revenue for dairy farms is coming from. The farms are consistently making changes to reduce cost. Volatility in pricing slows this process. The examples used in Charts V and VI are only a theoretical solution. Other solutions to reduce volatility should be considered.
The post on September 25, 2026, finished with a comment that the …
Production costs are lower with new processing facilities and the new facilities …
Data in this post is based on 12-month moving averages to eliminate …
The prior posts covered how the U.S. is becoming a dairy exporter. …