Butter and butterfat are driving producer milk prices. Recent posts covering this are listed below.
What is Happening to U.S. Dairy Products Consumption?
More Good News on Dairy Consumption
This post will cover strictly butter. It will cover butter consumption, production, inventory, imports, exports, and wholesale prices.
CONSUMPTION
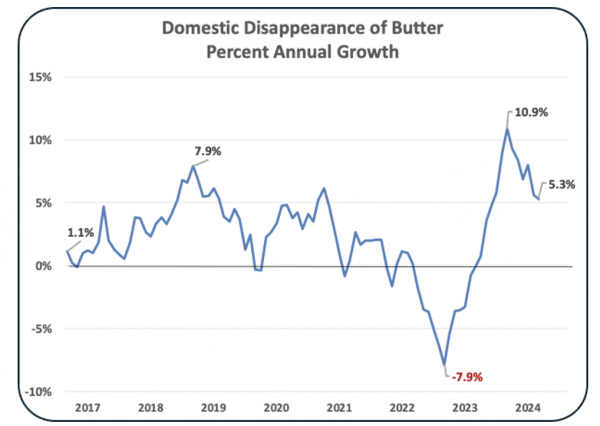
Very importantly, butter consumption is increasing. Chart I shows the annual increases in the last two years. Consumption increases are higher than at any time in the six-year history.
PRODUCTION
Butter production is increasing to meet demand. In the last two years, butter production in the U.S. has increased by 8% to record highs (Chart II).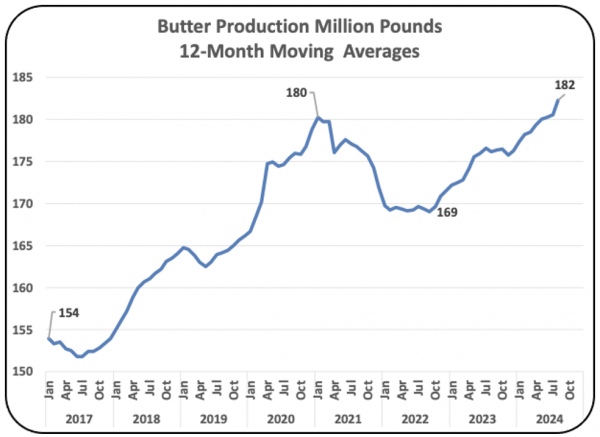
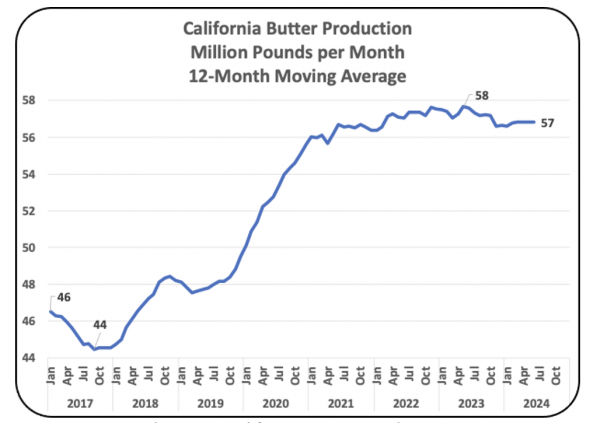
California has consistently contributed 33% of U.S. butter production, far above any other state. However, the U.S. increases in butter production are not coming from California. California butter production is static (Chart III). That means that the increases in U.S. butter production are coming from other states. That will diversify butter production and helps reduce distribution costs. This is a trend that will continue.
INVENTORIES
Wholesale butter inventories were low in 2023 but are now showing increases. During the COVID years, butter inventories increased with less demand as fewer were eating out. As COVID sanctions were lifted, inventories normalized and are now growing with increased U.S. butter production (Chart IV).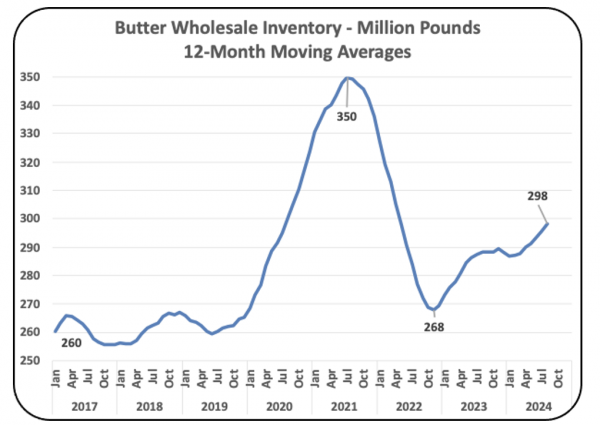
IMPORTS
Imports (Chart V) are increasing, with more butter primarily from Ireland and New Zealand. The Irish butter is unique with milk from grass feed cows and produced with a low water content. It helps fill the need for butter but will be difficult to change going forward (think Kerrygold).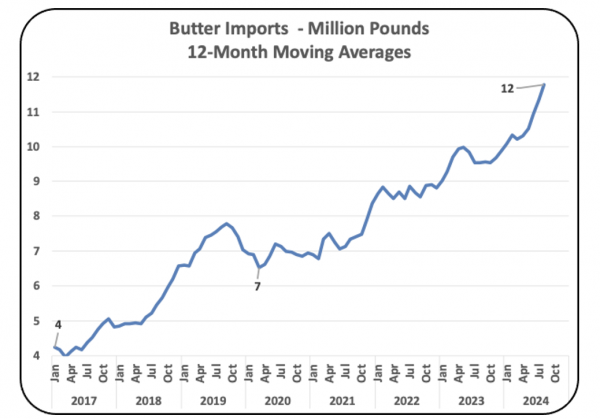
EXPORTS
Exports are minimal as inventories are low. Typically, there are significant exports of butter to Canada, but low inventories have slowed these exports.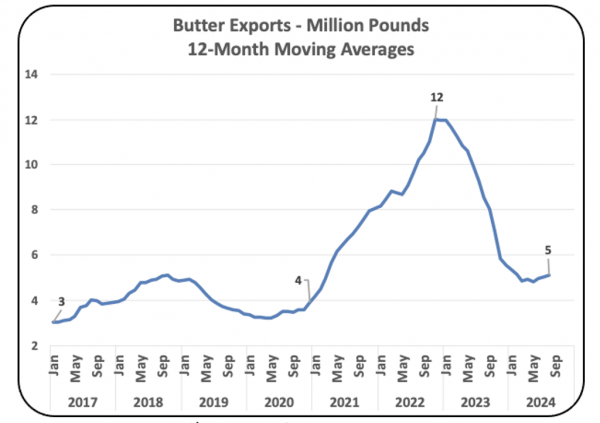
WHOLESALE PRICES
The wholesale prices are recently falling as inventories increase. This is expected as supply and demand balance. Although there is some decline in butter prices, they are still at historic highs.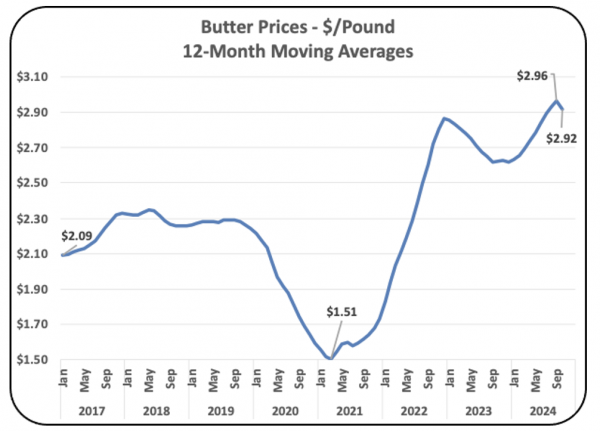
WHAT DOES ALL THIS MEAN?
Butter consumption is growing after years of static or decreasing consumption. The increases have slowed but are still significant. This means that production must continue to grow. In a prior post, it was noted that some of the butterfat is currently being removed from milk for cheese to fulfill the demand for butter. That butterfat is coming from cheese-producing states, and much will be churned in those states, geographically leveling butter production in the U.S.
Exports have increased only slightly, leaving room for increased exports in the future. This should keep the demand for U.S. butter high and producer butterfat prices reasonably high, but not record setting.
The growth in whole milk (see this post for details) will continue to pressure butterfat that can be churned.
Increasing cheese consumption has slowed (see this post, Chart III)). If this changes to a more robust growth in cheese consumption, that will further put pressure on butterfat for churning. A lot more butterfat goes to cheese than butter, although the USDA/AMS continues to price butterfat based on butter prices.
All the summary paragraphs above point to high butter and butterfat prices in the foreseeable future. Increasing butterfat in milk will remain a key to dairy revenue.


