


Increasing components is the best way to increase producer revenue and producers throughout the U.S. are accomplishing this with a continuing increase in component levels. The most recent data published June 24, 2025, shows continuing growth for butterfat component levels and accelerated growth for milk protein levels. This post will cover the level of increases for the Federal Orders in total and by individual Federal Orders. This is an update from the April 2025 post. Remember that these are the averages and roughly half of producers have component levels higher. The data used in this post is based on 12-month moving averages to minimize monthly volatility.
Chart I below shows the increase in percent butterfat for all 11 Federal Orders combined. The increases have been steady year-by -year and show an increasing rate of improving butterfat levels. Butterfat prices have increased as domestic demand for butter has increased. All Federal Orders pay for butterfat based on the USDA formulas.
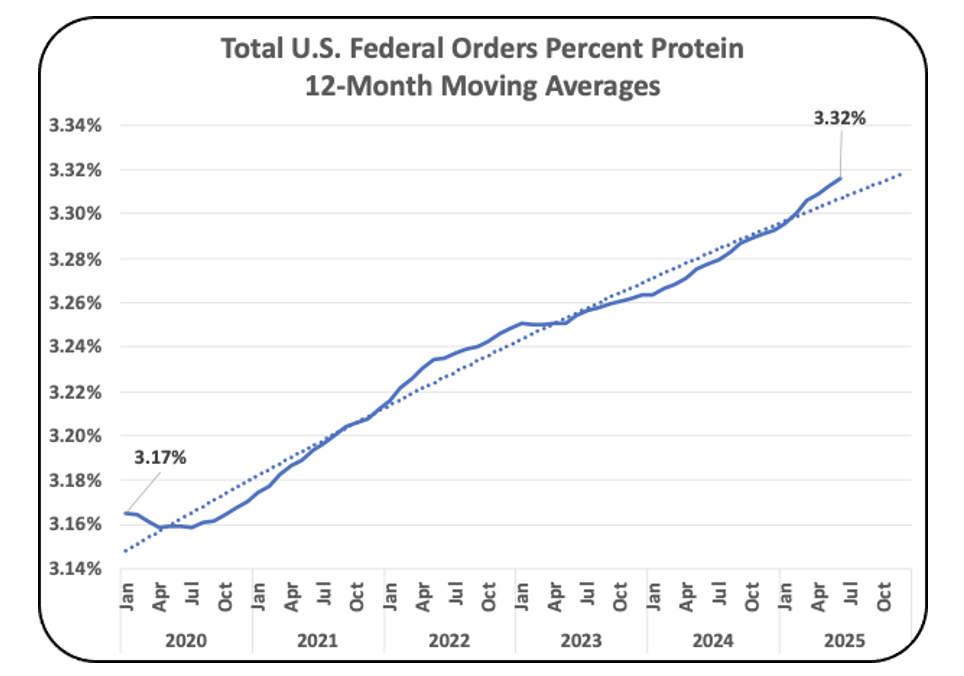
Chart II below shows the increase in milk protein for the seven Federal Orders that pay for protein specifically. The increases here are also steady, but not as strong as the increases in butterfat levels. Currently, butterfat prices are at $2.66 per pound and milk protein is priced at $2.48 per pound.
The rate of increase in protein levels is accelerating in 2025.
BUTTERFAT DETAILS
Table I below lists the current level of butterfat for each Federal Order. Table II lists the percent increases in butterfat in the last five years for each Federal Order. The four Federal Orders paid by the “Advanced” system are all at the bottom of the list in terms of butterfat content, but Arizona is making gains with a 10.1% increase in butterfat levels in the last five years. The Upper Midwest ranks high in butterfat levels and gains in increasing these levels.
The Northwest Federal Order has always ranked high in butterfat levels with their focus on cows with high component levels. The Mideast and Upper Midwest Federal Orders have made great gains with 9.7% and 9.6% increases in butterfat levels over the five years covered in this analysis.
PROTEIN DETAILS
Protein levels have made nice increases with a 4.8% increase in protein levels over five years (Table IV). However, that pales in comparison to the 8.8% increase in butterfat.
California has done an outstanding job of increasing protein levels by 5.2% and moving up in the rankings to third place (Table III).
THE BOTTOM LINE
With butterfat currently valued of $2.66 per pound, increasing butterfat from 3.90% to 4.25% increases butterfat in a cwt. of milk by .35 pounds worth $.93 per cwt. of milk
With Protein currently valued at $2.48 per pound, increasing protein from 3.16% to 3.32% increases protein in a cwt. of milk by .16 pounds worth $.40 per cwt. of milk.
That is an increase of $1.33 in every cwt. of milk delivered.
Increasing components is the best way to increase producer revenue and producers throughout the U.S. are accomplishing this with a continuing increase in component levels. The most recent data published June 24, 2025, shows continuing growth for butterfat component levels and accelerated growth for milk protein levels. This post will cover the level of increases for the Federal Orders in total and by individual Federal Orders. This is an update from the April 2025 post. Remember that these are the averages and roughly half of producers have component levels higher. The data used in this post is based on 12-month moving averages to minimize monthly volatility.
Chart I below shows the increase in percent butterfat for all 11 Federal Orders combined. The increases have been steady year-by -year and show an increasing rate of improving butterfat levels. Butterfat prices have increased as domestic demand for butter has increased. All Federal Orders pay for butterfat based on the USDA formulas.
Chart II below shows the increase in milk protein for the seven Federal Orders that pay for protein specifically. The increases here are also steady, but not as strong as the increases in butterfat levels. Currently, butterfat prices are at $2.66 per pound and milk protein is priced at $2.48 per pound.
The rate of increase in protein levels is accelerating in 2025.
BUTTERFAT DETAILS
Table I below lists the current level of butterfat for each Federal Order. Table II lists the percent increases in butterfat in the last five years for each Federal Order. The four Federal Orders paid by the “Advanced” system are all at the bottom of the list in terms of butterfat content, but Arizona is making gains with a 10.1% increase in butterfat levels in the last five years. The Upper Midwest ranks high in butterfat levels and gains in increasing these levels.
The Northwest Federal Order has always ranked high in butterfat levels with their focus on cows with high component levels. The Mideast and Upper Midwest Federal Orders have made great gains with 9.7% and 9.6% increases in butterfat levels over the five years covered in this analysis.
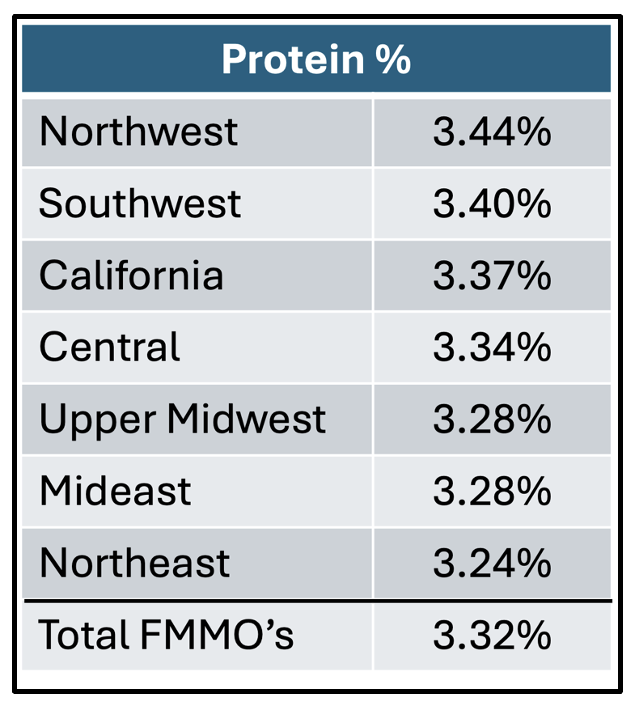
PROTEIN DETAILS
Protein levels have made nice increases with a 4.8% increase in protein levels over five years (Table IV). However, that pales in comparison to the 8.8% increase in butterfat.
California has done an outstanding job of increasing protein levels by 5.2% and moving up in the rankings to third place (Table III).
THE BOTTOM LINE
With butterfat currently valued of $2.66 per pound, increasing butterfat from 3.90% to 4.25% increases butterfat in a cwt. of milk by .35 pounds worth $.93 per cwt. of milk
With Protein currently valued at $2.48 per pound, increasing protein from 3.16% to 3.32% increases protein in a cwt. of milk by .16 pounds worth $.40 per cwt. of milk.
That is an increase of $1.33 in every cwt. of milk delivered.
This post covers a different view of the shifting dairy business. The …
Prior posts covered the low prices for producer milk. The value of …
De-pooling from a Federal Order has a significant financial impact on dairy …
The USDA report on sales of fluid milk lists categories such as …