Dairy products continue to evolve to support health benefits and increase appeal of dairy products. The development of appealing products and the many changes in dairy herds have kept sales stable and with minimal inflation as covered in a recent post to this blog.
There must always be continuous changes in all dairy aspects and hopefully some of these changes will help reduce producer revenue volatility making milk production more desirable.
Prior posts covered the low prices for producer milk. The value of …
De-pooling from a Federal Order has a significant financial impact on dairy …
The USDA report on sales of fluid milk lists categories such as …
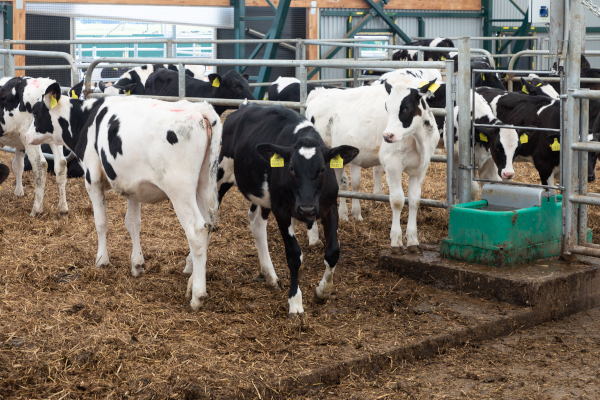
The milk cow population in the U.S. has grown significantly in 2025 …