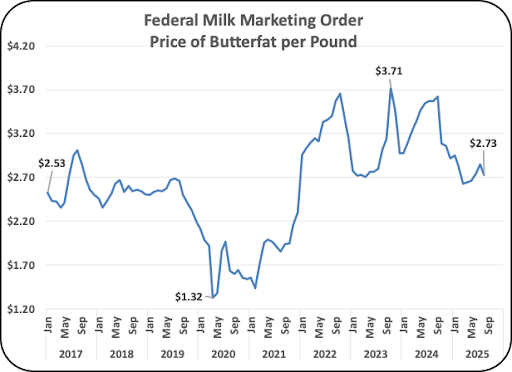
For four years butterfat has been the largest revenue source for dairy producers. The value of butterfat began increasing in 2022 and reached a record price of $3.71 per pound in late 2023. In 2024 and 2025 the price began declining (Chart I). Because butterfat is the largest contributor to producer and processor revenue, the changes are closely followed in dairy publications. The data in the charts below follow the changes in the many elements that can influence butterfat pricing. The pricing of butterfat is calculated from the wholesale prices of butter using USDA formulas. This post is an update to the July 23, 2025 post.
The reason for the butterfat price increases and decreases are simply a matter of supply and demand. Because the butterfat supply and demand has a strong annual rhythm, much of the data in this post is based on 12-month moving averages.
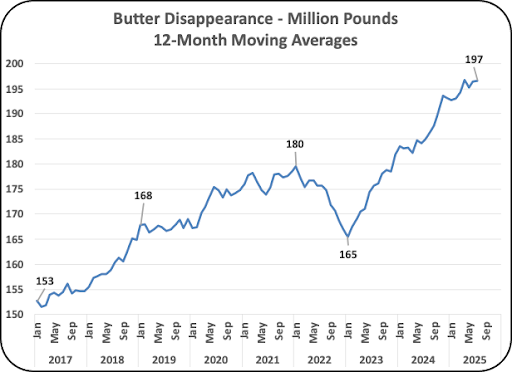
- Chart II shows the 29% increase in wholesale domestic disappearance over the span of the chart. The increasing rate is slowing.
- Chart III shows the production of butter which has increased by 25%.
- Chart IV shows a 15% increase in wholesale inventory over this same period. The wholesale inventory includes imports minus exports as well domestic production.
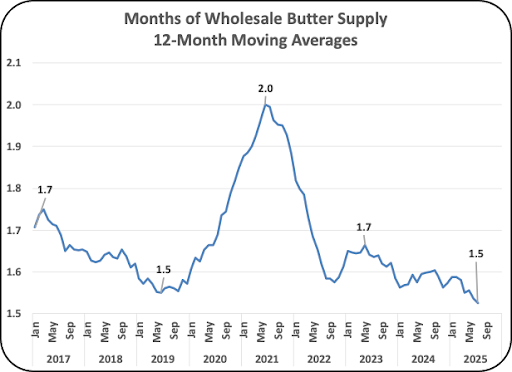
- Chart V shows the months of supply that the inventory will sustain. It is at the lowest level on the chart with a trend to increasingly lower levels. The current inventory level is down 12% over the span of the chart.
The chart levels currently show a very tight inventory level, not a glut of butter.
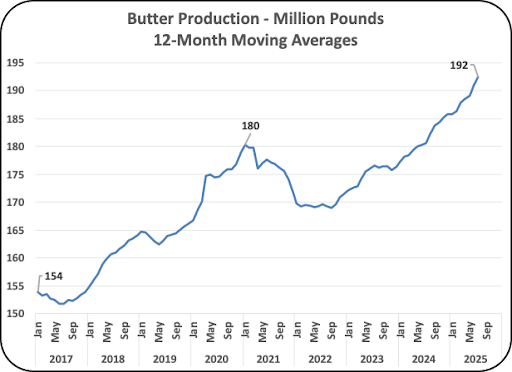
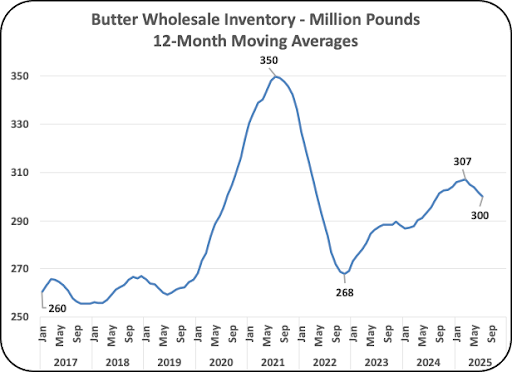
Because the volume of butter produced has increased significantly over this period, there is concern that there is too much butter being produced. Because the butterfat price is also going down, it would also indicate that the inventories are growing. Adding to this, exports of butter are up, and imports are decreasing. The issue is that butter disappearance is still faster than domestic production of butter.
Below are two sets of data covering the export and import trends. The first set plots the monthly exports and imports. The second set covers the 12-month moving averages of exports and imports. Boths sets of data also chart the “net exports” which are the exports minus the imports. Butter has a regular annual trend with very high usage at the end of the year during the holiday season. Butter supply and demand is managed to provide adequate supplies. As mentioned above the 12-month moving averages track the annual trends.
- Butter exports (Chart VI) in the monthly data show a record level of exports currently.
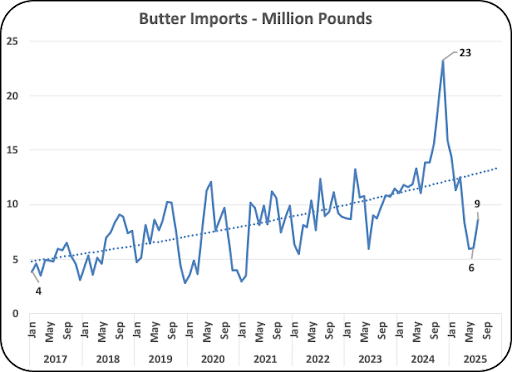
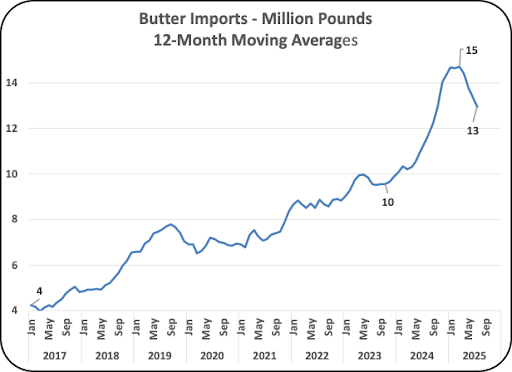
- Butter Imports show large increases in imports in 2024 to meet domestic demand for butterfat. In 2025, through July (Chart VI) the monthly imports have decreased (Chart VII).
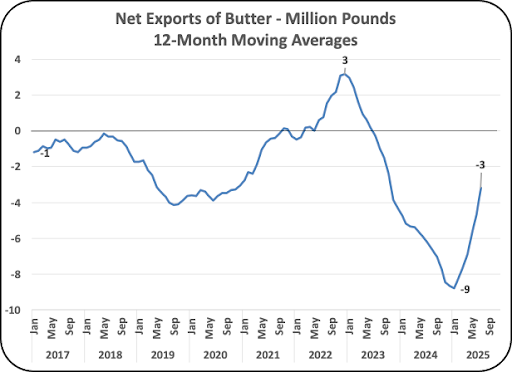
- The net exports in Chart VIII show a huge change from very negative net exports to very positive net exports in 2025.


- The 12-month moving averages of butter exports in Chart IX show a similar pattern to the monthly exports in Chart VI but with a much smaller range. The monthly range in monthly exports in 2024 through July 2025 range by 16 million pounds in the monthly charts and range by 5 million pounds in the 12-month moving averages.
- The 12-month moving averages of butter imports in 2024 through July 2025 range by 5 million pounds. The monthly range of butter imports (Chart VII) is 17 million pounds.
- The 12 month moving averages of butter net exports in 2024 through July 2025 range by 6 million pounds while the monthly data range by 26 million pounds.

By using 12-month moving averages, the annual movements can be traced one month at a time. The data shows that the balance between production and domestic use still needs to increase butterfat and butter domestically to meet demand. Prices of butterfat need to be high enough to encourage growth of milk production and transportation of milk to new churning facilities.


